Table of Contents
Your performance reports and comparison reports just got a serious upgrade. Every KPI now carries a descriptive tooltip explaining exactly what it measures and how it is calculated - and a new set of KPIs covering gross and net P&L breakdowns, trade counts, and the System Quality Number (SQN) is now available across stocks, options, futures, forex, crypto, and more - on every plan.
What does every KPI tooltip tell you?
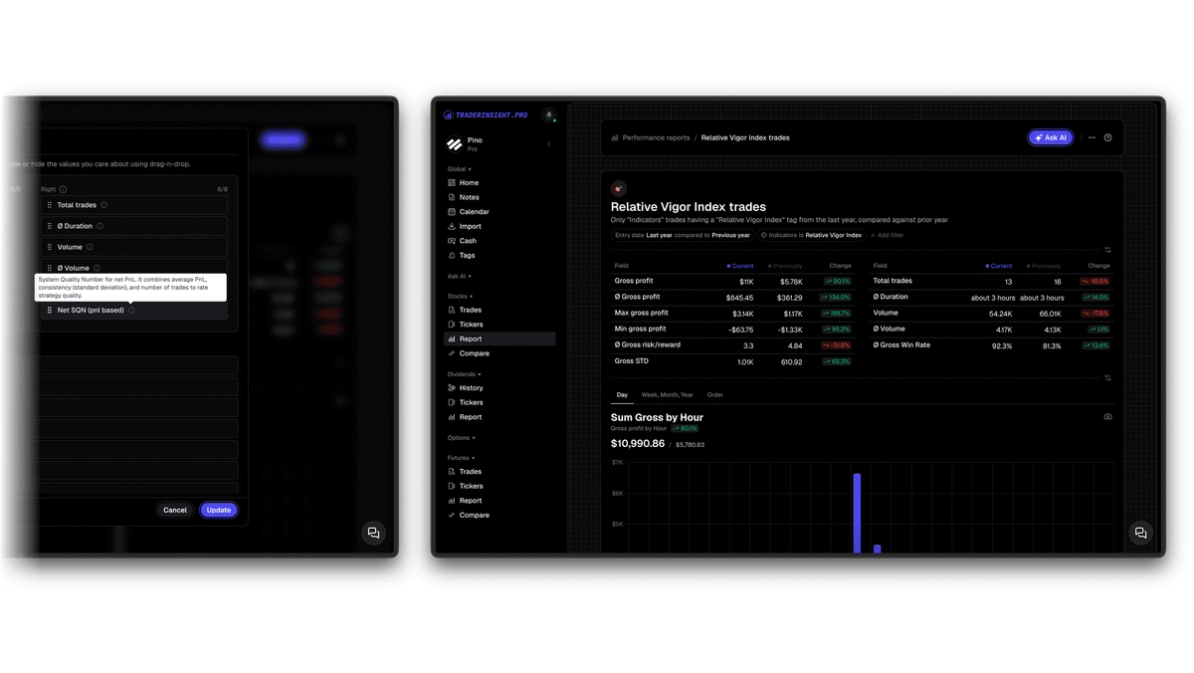
Every KPI in your reports now includes a tooltip that explains what the metric measures, how it is calculated, and what a high or low value typically means for your trading. You no longer need to leave the platform to look up definitions or second-guess what a number is actually telling you. Hover over any KPI and the explanation is right there.
This applies across both performance reports and comparison reports, so whether you are reviewing a single strategy's history or running a side-by-side comparison between setups, the full context for every number is a hover away.
What are the new KPIs?
The new KPIs give you a cleaner and more precise breakdown of where your P&L is actually coming from - before and after commissions, fees, and other costs. They are available immediately in all reports, on all plans.
Gross P&L breakdown
Sum Gross Gain and Sum Gross Loss show your total winning and losing P&L before any fees or commissions are applied. These are the raw trade results - useful for isolating whether your entries and exits are generating value independent of execution costs.
Count Gross Gain Trades, Count Gross Loss Trades, and Count Gross Even Trades give you the number of trades that were profitable, losing, or flat on a gross basis. Comparing these to their net equivalents immediately tells you how many trades are being pushed from profit to loss (or even) purely by fees.
Net P&L breakdown
Sum Net Gain and Sum Net Loss show your total winning and losing P&L after all fees and commissions are deducted - your real-world result. These are the numbers that actually matter for your bottom line.
Count Net Gain Trades, Count Net Loss Trades, and Count Net Even Trades mirror the gross trade counts but applied to your final net results. Tracking the gap between gross and net trade counts is one of the sharpest ways to understand whether your cost structure is undermining otherwise solid setups.
Why the gross vs net split matters
The difference between your gross and net results is rarely just an accounting detail. For traders paying significant commissions or trading in high-spread instruments, a setup that looks profitable on a gross basis can be quietly losing money once costs are factored in. With both sets of KPIs visible side by side in your performance reports, that gap becomes immediately visible - and actionable.
What is SQN and why does it matter?
SQN - the System Quality Number - is one of the most informative single metrics available for evaluating a trading strategy, and it is now calculated directly inside your reports.
Developed by Van Tharp, SQN measures the relationship between a strategy's average reward-to-risk ratio and the standard deviation of that distribution, scaled by the square root of the number of trades. In practical terms: a high SQN means your strategy produces consistent, reliable results relative to its variability. A low SQN means the results are noisy, inconsistent, or dependent on a small number of outsized wins.
Two variants are now available:
- SQN (Net) - calculated on net P&L after commissions and fees
- SQN (Gross) - calculated on gross P&L before costs
The standard SQN score ranges give you immediate context:
- Below 1 - very hard to trade
- 1 to 2 - average
- 2 to 3 - good
- 3 to 5 - excellent
- 5 to 7 - superb
- Above 7 - Holy Grail
Most traders have never calculated SQN for their own live results because the math is tedious to run manually. It now appears automatically in your performance reports alongside its tooltip explaining exactly how to interpret the number. Running it across strategies in a comparison report gives you an objective, single-number ranking of which setups are worth developing further and which are producing returns too dependent on luck or outliers.
How to use these KPIs in comparison reports
Comparison reports let you filter by strategy tags, asset class, time period, session, and more - and now display the full suite of gross and net KPIs alongside SQN for each segment. This makes it straightforward to answer questions like:
- Which of my strategies has the highest SQN on a net basis?
- Am I losing more trades to commissions in my options setups than in my futures setups?
- Is my gross win rate meaningfully different from my net win rate - and in which strategies?
The combination of SQN with gross/net trade count comparisons inside a single comparison view gives you a quantitative framework for deciding where to focus, scale, or cut.
Which asset classes and plans are supported?
All new KPIs - including SQN gross, SQN net, all gross P&L breakdowns, and all net P&L breakdowns - are available for stocks, options, futures, forex, crypto, and more, on every plan.
Open your performance reports or comparison reports and the new KPIs are ready to get activated for your reports.
Start analyzing your results
If you do not have a journal yet, start your trial and import your trade history to see your SQN, gross/net breakdowns, and every other KPI immediately.
Do you want to see another KPI getting added? Let us know
FAQs
What is SQN in trading?
SQN (System Quality Number) is a metric developed by Van Tharp that measures the quality and consistency of a trading strategy by comparing its average reward-to-risk ratio against the standard deviation of that ratio, scaled by the square root of trade count. TraderInsight.pro calculates both gross and net SQN automatically in your performance reports.
What is the difference between gross and net KPIs?
Gross KPIs measure your P&L and trade outcomes before commissions and fees are deducted. Net KPIs reflect your actual realized results after all costs. Comparing the two in TraderInsight.pro's performance reports shows you exactly how much your cost structure is affecting your bottom line.
Which asset classes support the new KPIs?
Are the new KPIs available on all plans?
Yes. Every new KPI, including SQN gross and net, is available on all TraderInsight.pro plans. See pricing for plan details.
What does the KPI tooltip show me?
Each tooltip explains what the KPI measures, how it is calculated, and how to interpret a high or low value in the context of your trading. The tooltips are visible by hovering over any KPI in your performance reports or comparison reports.
How do I compare SQN across strategies?
Use comparison reports filtered by strategy tags. SQN (gross and net) appears for each segment, giving you a direct quantitative comparison of strategy quality across your entire trading history.
Can I see gross vs net KPIs for options specifically?
Yes. All gross and net KPIs are fully supported for options trades, including multi-leg strategies, making it straightforward to see how assignment fees, exercise costs, and commissions affect your real results versus your raw trade performance.