Table of Contents
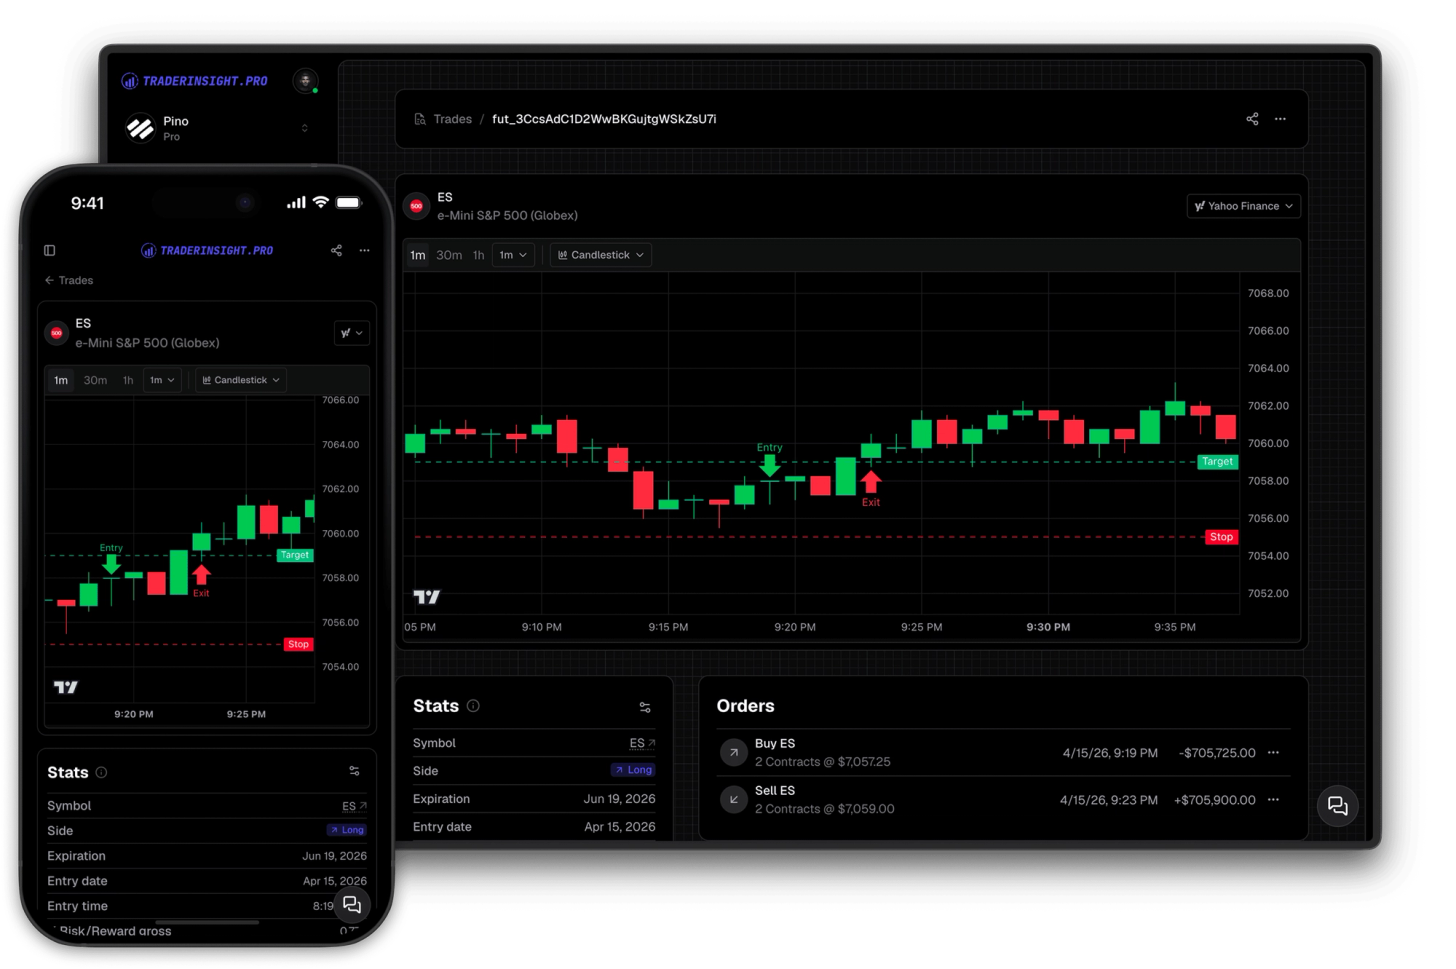
Your entries, exits, stop losses, and target prices are now plotted directly on the historical price chart for every trade in your journal. No more trying to mentally reconstruct where you got in and out - the chart shows you exactly what happened, at the exact price and time it happened.
This works across stocks, futures, forex, options, crypto, and more - included in every TraderInsight.pro membership.
What does the new chart show?
The new trade chart plots your actual trade data directly onto the historical price chart. For every trade in your journal you can see your entry price and entry time, your exit price and exit time, your stop loss level, and your target price - all marked at the precise moment they occurred on the real price history.
This is the fastest way to visually review a trade. You can see immediately whether your stop was too tight, whether your target was realistic given the price action, and whether your entry was well-timed relative to the surrounding candles - without leaving your journal.
How to switch between chart types on a trade
The trade chart is the default for futures trades. For all other asset classes, a dropdown on the trade detail page lets you switch between the trade chart and the full TradingView chart instantly. Both chart types are available on the same page - switch between them in one click to get the view you need.
What is the difference between the trade chart and the TradingView chart?
Both chart types are available on every trade page and serve different purposes.
The trade chart is focused on your trade data. It shows your entries, exits, stops, and targets plotted onto the actual price history, giving you an immediate visual picture of how the trade played out. This is the chart you want for reviewing execution quality, evaluating whether your levels were sensible, and building pattern recognition across your trades.
The TradingView chart gives you the full power of TradingView - every indicator, drawing tool, and technical analysis feature the platform offers. This is the chart you want when you want to go deeper: check an indicator reading at the time of entry, overlay volume, or study the broader market structure around the trade.
Both charts are included in every plan. Use whichever one gives you the answer you need.
Why seeing your entries and exits on the chart changes how you review trades
Most traders review trades using numbers: P&L, win rate, R:R. These are important. But numbers alone do not show you why a trade worked or failed. Seeing your entry and exit plotted on the actual candles does.
When you can see that your stop was placed just below a support level that held, or that you exited two candles before the move accelerated, you learn something that no P&L column can tell you. This kind of visual review compounds over time - patterns in your execution become obvious, and you can act on them.
Combined with AI analysis, strategy tags, and performance reports, the trade chart gives you one more layer of context for every trade you have ever made.
Which plans include the trade chart?
The trade chart with entries, exits, stops, and targets is available on all TraderInsight.pro plans starting today. There is no add-on or upgrade required - it is part of every membership.
If you are not yet journaling your trades, start your trading journal and every trade you import will have both chart views available immediately.
How to get the most out of your trade charts
How to review your stop placement visually
Open any trade, select the trade chart, and look at where your stop was marked relative to the surrounding price action. Was it placed at a logical level, or was it arbitrary? Do this across 20 or 30 trades and patterns emerge quickly. Pair this with performance reports filtered by stop placement to see whether tighter or wider stops are affecting your outcomes.
How to evaluate whether your targets are realistic
The target price marker shows you exactly where you were aiming when you entered the trade - and the exit marker shows you where you actually got out. If your exit is consistently far from your target, the chart makes that gap visible in a way that a spreadsheet never could. Use tags to group trades by target type and compare performance across setups in comparison reports.
How to spot patterns in your entries across your trade history
Scroll through your trades using the trade chart view and look at the entry markers in context. Were you consistently entering late, after the move had started? Were you getting in at resistance and wondering why the trade reversed? Visual review across many trades is one of the fastest ways to identify systematic problems in your execution.
How to combine chart review with your trading calendar
After a visual chart review session, cross-reference your findings with the trading calendar to see whether your best and worst executions cluster around specific days or sessions. Context matters - a trade that looks bad in isolation may have made sense given the session conditions.
Available on mobile
Both chart types are fully available in the TraderInsight.pro mobile app. Review your trades and see your entries and exits on the chart from anywhere, with the same functionality as the desktop experience.
Frequently asked questions
Does the trade chart work for all asset classes?
What trade data is plotted on the trade chart?
Your entry price, entry time, exit price, exit time, stop loss, and target price are all marked directly on the historical price chart at the correct time and price level.
Does this replace the TradingView chart?
No. Both charts are available on every trade page and you can switch between them using the dropdown. The TradingView chart with full indicators is still there - the Yahoo Finance chart is an addition, not a replacement.
Do I need to do anything to enable this?
Nothing. It is available on all plans immediately. Open any trade in your journal and use the dropdown to select your preferred chart type.
Can I use this on older trades I already imported?
Yes. The chart works for every trade in your journal, including all historical trades you have already imported.
Is the trade chart available on mobile?
Yes. Both chart types are available in the TraderInsight.pro app with full functionality.
Which plan do I need to access the trade chart?
It is included in every TraderInsight.pro membership.
Can I share a trade chart with my mentor or trading group?
Yes. Use the sharing feature to share individual trades or journal views with mentors, team members, or your journal members.
Where can I request a new feature or chart type?
Use the feature request form - the platform is built by traders and shaped by what traders actually need.
Start your trading journal and see every trade you have ever made on the chart, exactly as it happened.