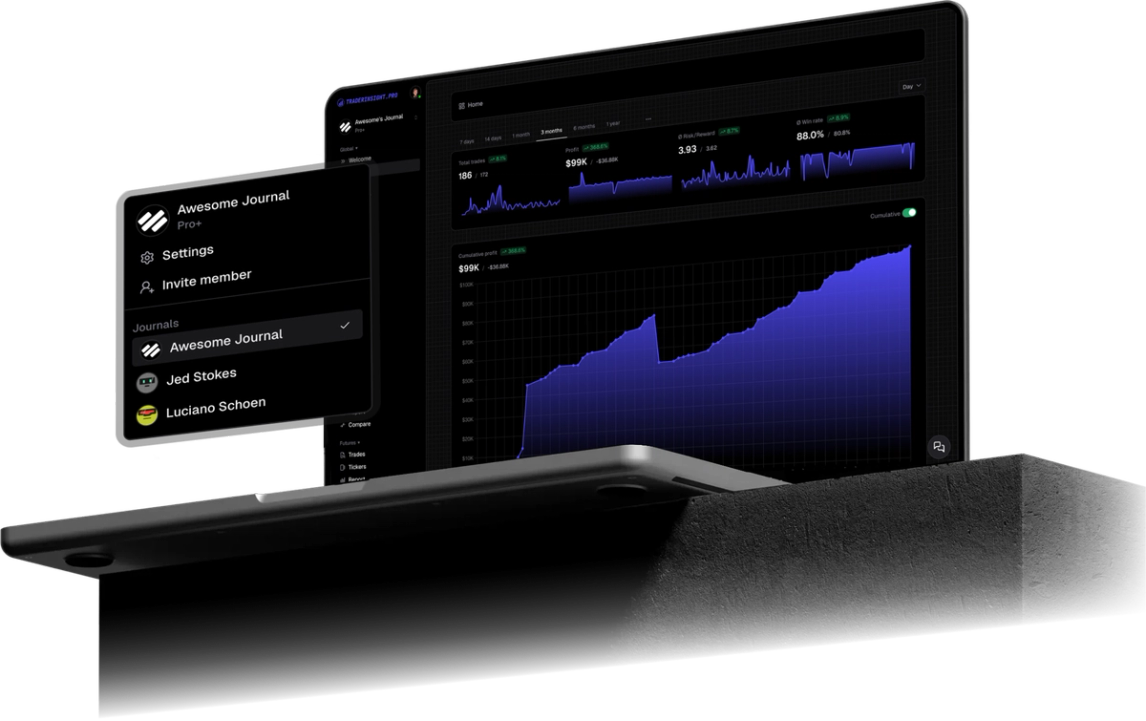

Mobile Journal App
Your full trading journal on any device
Access all features seamlessly across your main machine and your mobile device with our downloadable apps. Enjoy full functionality wherever you go.
Knowing your overall win rate is a start. Knowing that your Breakout strategy wins 68% of the time while your Reversal strategy loses money on average - that's actually useful. Most trading journals stop at the first number. Comparison reports give you the second, third, forth and fifth.
The idea is simple: build filters for any slice of your trading - a strategy, a mistake, a time window, a profit range, a hold duration - and then compare those slices side by side in a single report. Your top five strategies. Your 10 most expensive mistakes. Morning session versus afternoon. High volume days versus low. Whatever question you're actually trying to answer.
Every comparison report starts with a solid default - predefined KPIs, stats, and charts that cover the most important angles out of the box. From there you can add charts, swap metrics, create new tabs, and reshape the whole thing until it reflects exactly what you need.
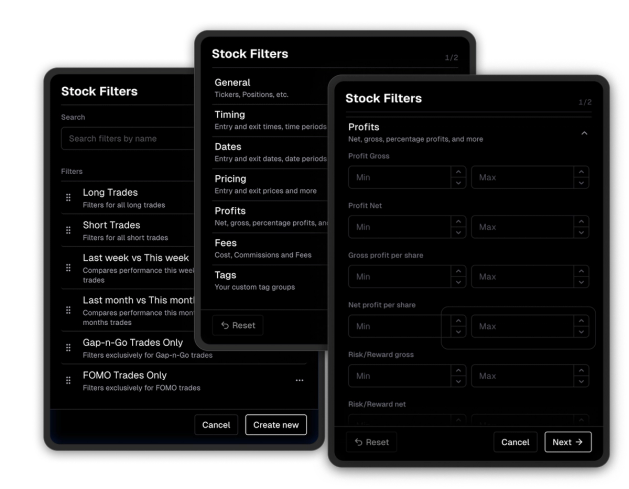
Filter by strategy, mistake, tag, profit range, hold time, volume, market condition - any property on your trades. Each filter defines a group, and you can be as broad or as specific as you need. One filter for each of your top setups, or one for every mistake you've tagged in the last six months.
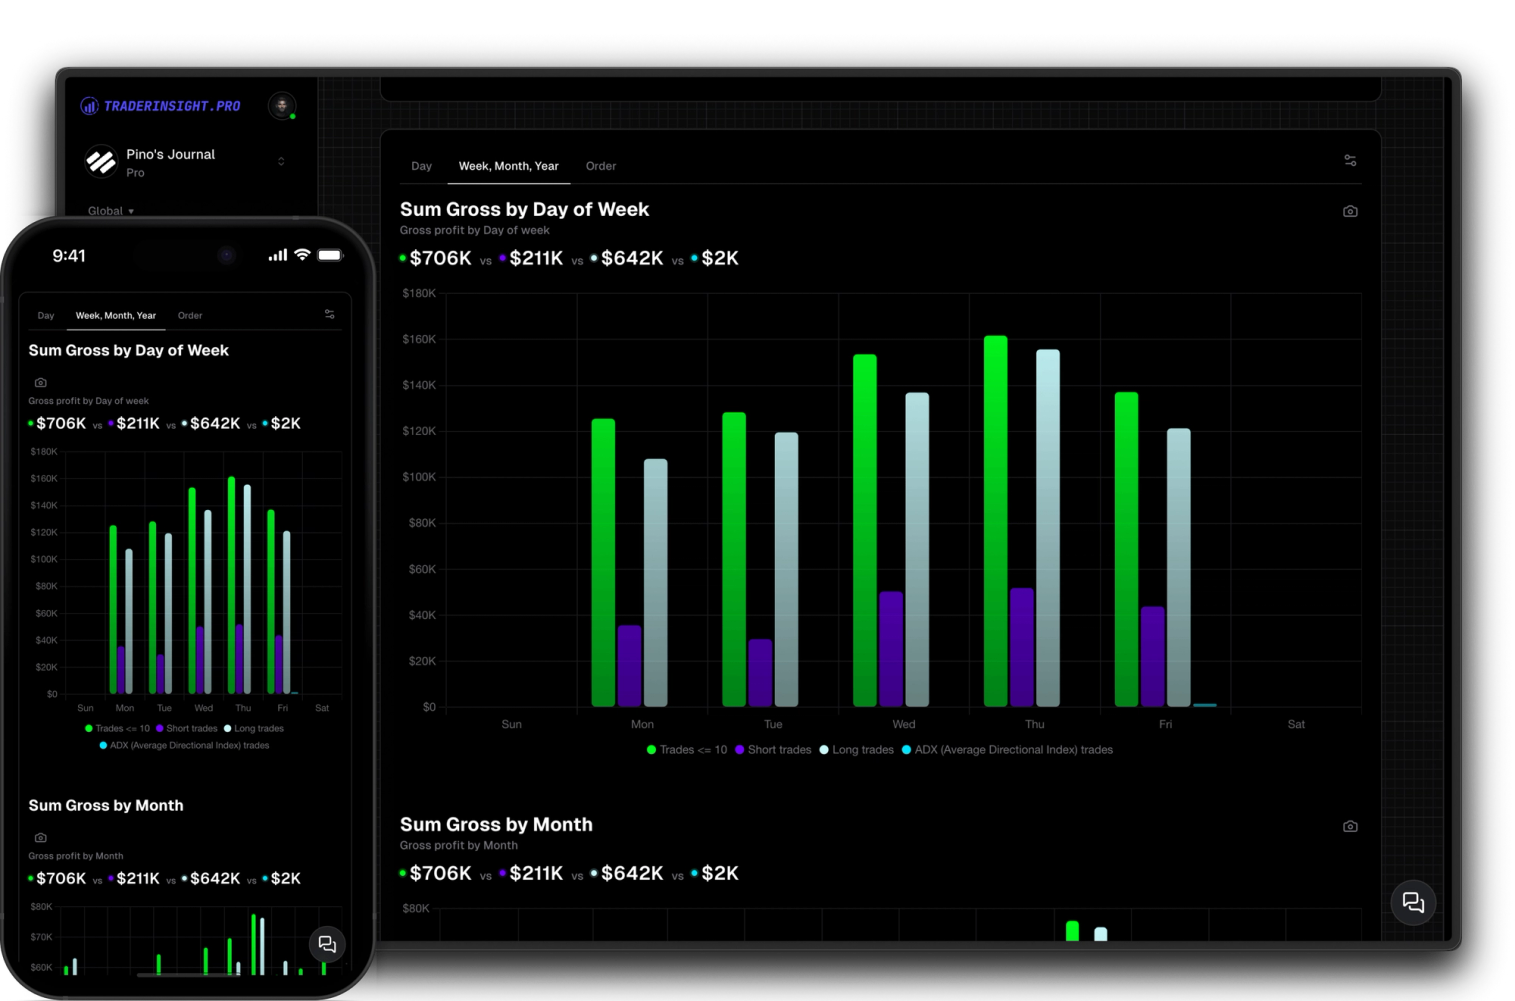
Stack your filters into a comparison report and see every metric - win rate, average P&L, R:R, hold duration, and more - broken out per group, in parallel. Patterns that were invisible in your overall stats become obvious the moment you put two groups next to each other.
The default report gives you a strong starting point with the most useful metrics pre-built. But every element is editable - add charts, adjust KPIs, reorganize into tabs, remove what doesn't apply. Your comparison report should reflect how you think about your edge, not a generic template.
Discover answers to frequently asked questions right here. If you can't find what you're looking for then reach out.
Any property on your trades - strategies, mistakes, tags, profit range, hold duration, volume, market conditions, time of day, and more. If it's on your trade, you can filter by it.
Two or more. Compare two strategies head to head or line up ten mistake tags side by side in the same report.
The default report includes the most important trading metrics out of the box - win rate, average P&L, R:R, hold duration, trade count, and more. Every metric is customizable.
Yes, fully. Add or remove charts, update KPIs, create new tabs to organize sections, and adjust any stat. The report is yours to shape however you need.
Yes. Comparison reports work across all asset types - stocks, options, futures, crypto, forex, and more. Filters apply to whatever trades are in your journal.
Yes. If you've imported trades from multiple brokers, you can filter by broker and compare performance across platforms in the same report.
A standard performance report shows your overall stats. A comparison report breaks your trades into groups - by strategy, mistake, time window, or any other filter - and shows every metric for each group side by side, so differences become immediately visible.
Access all features seamlessly across your main machine and your mobile device with our downloadable apps. Enjoy full functionality wherever you go.
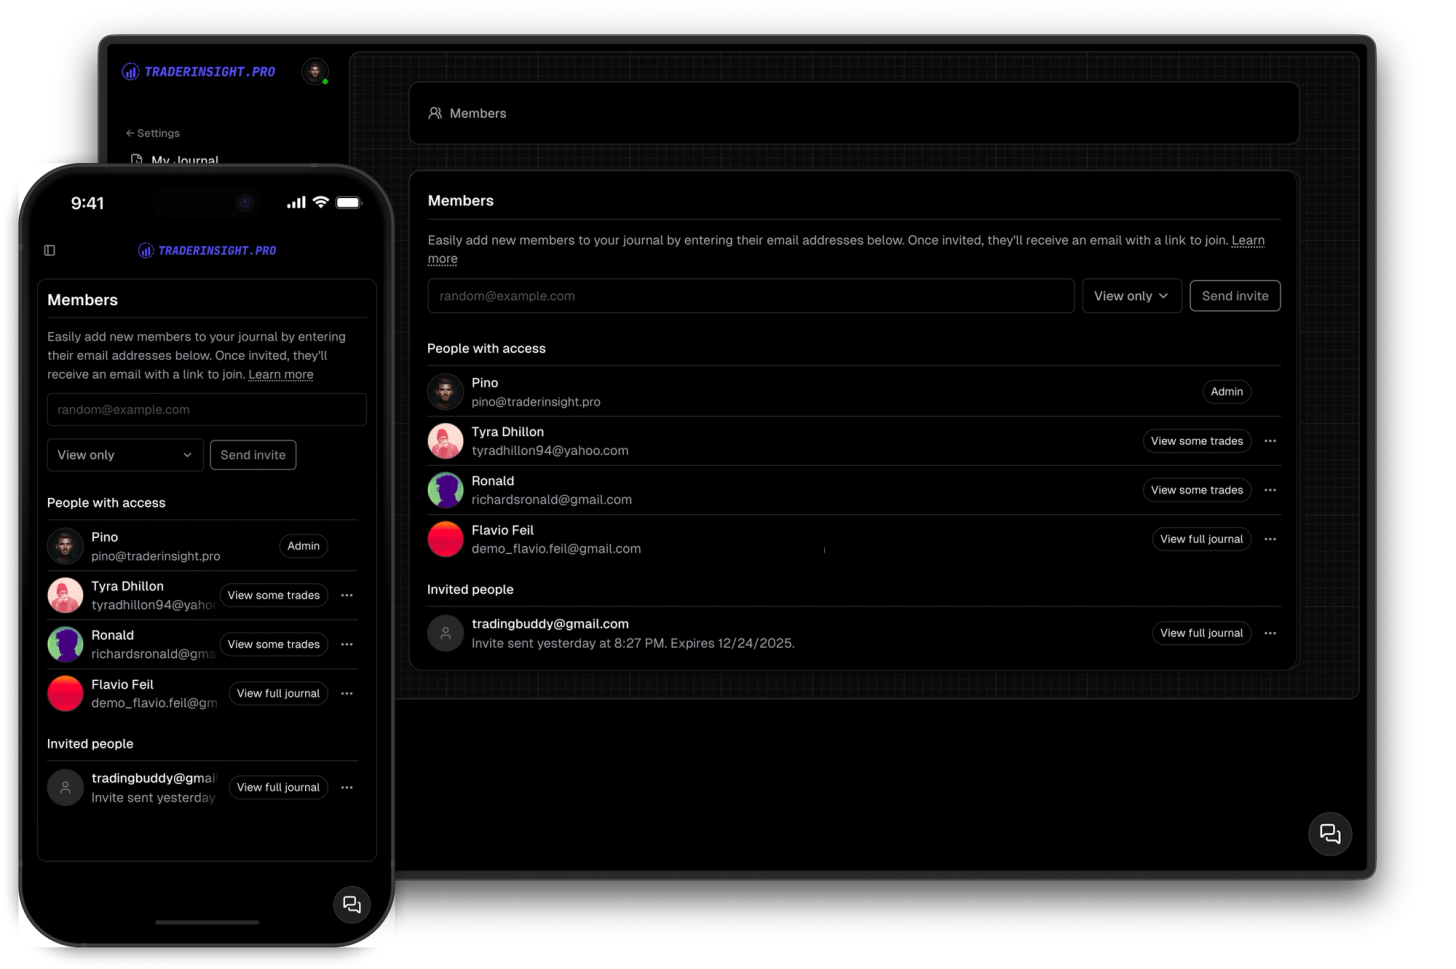
Share your journal with your friends, teammates, mentors or mentees so tha they can follow your trading journal.
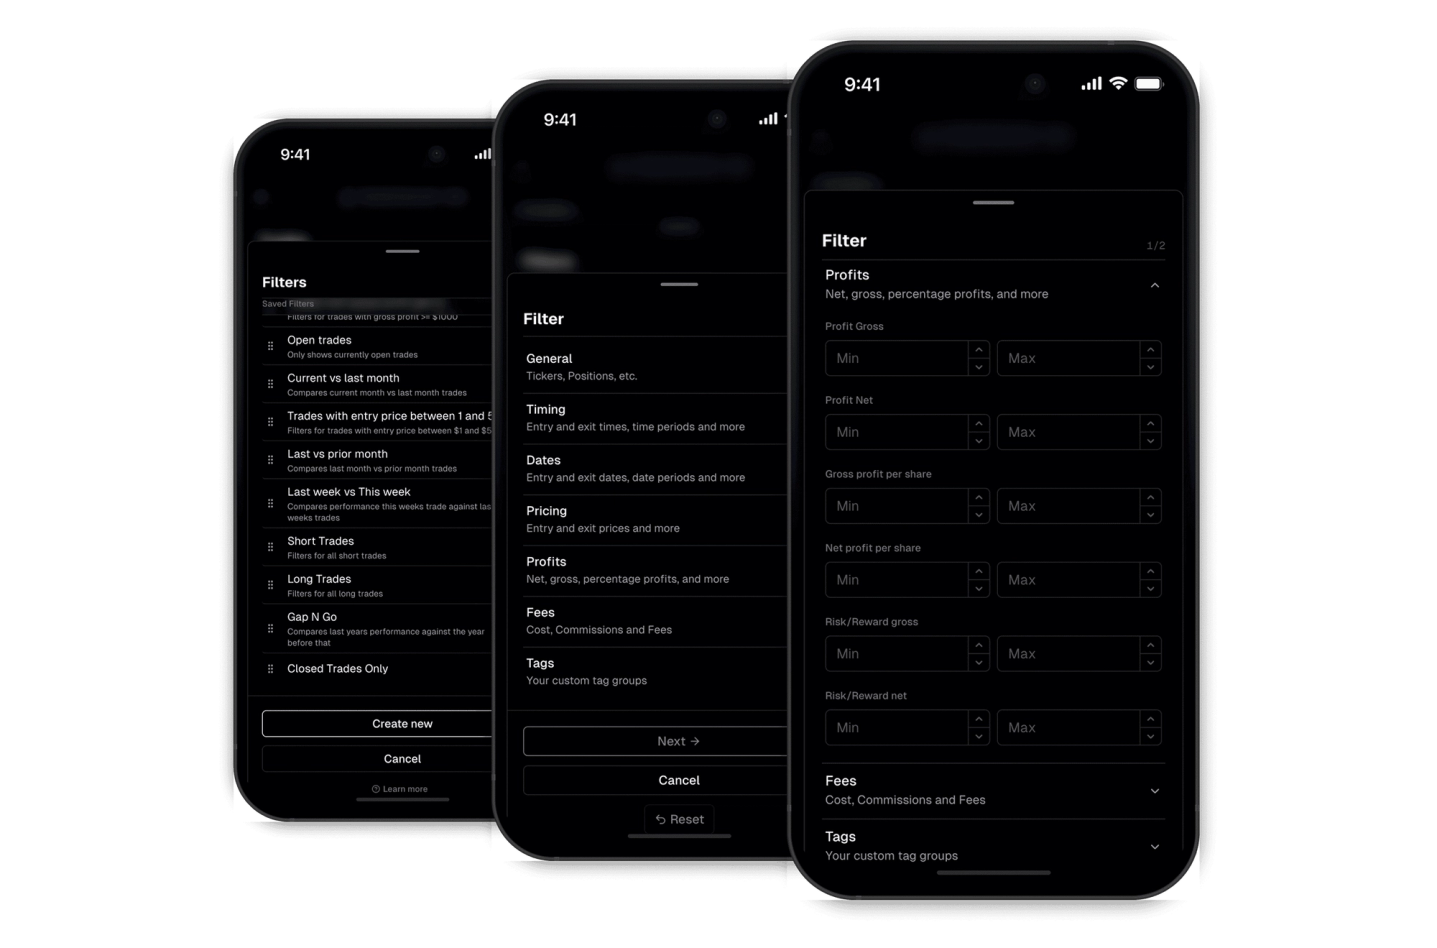
Effortlessly find what you're looking for with our robust filtering system. The custom filters empower you to drill down and extract meaningful insights.