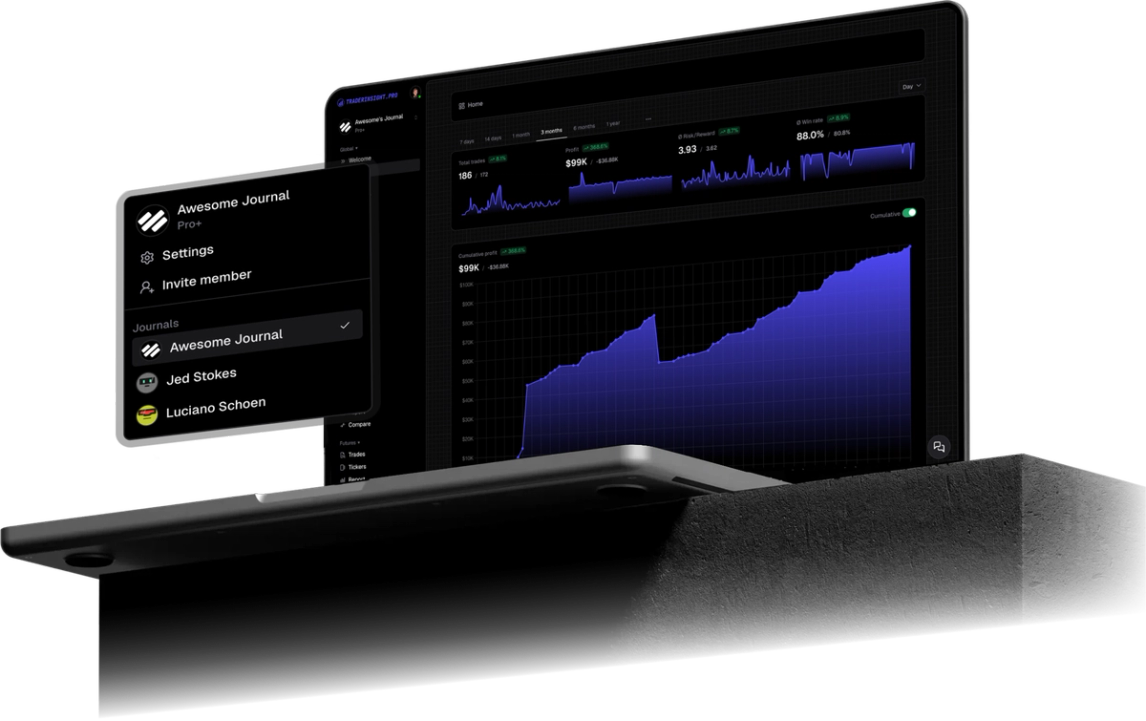
Comparison Reports
Compare all trading strategies and more side by side
Harness the power of comparisons to optimize your trading. Easily compare your custom filters, not just strategies, to identify what works best for you.
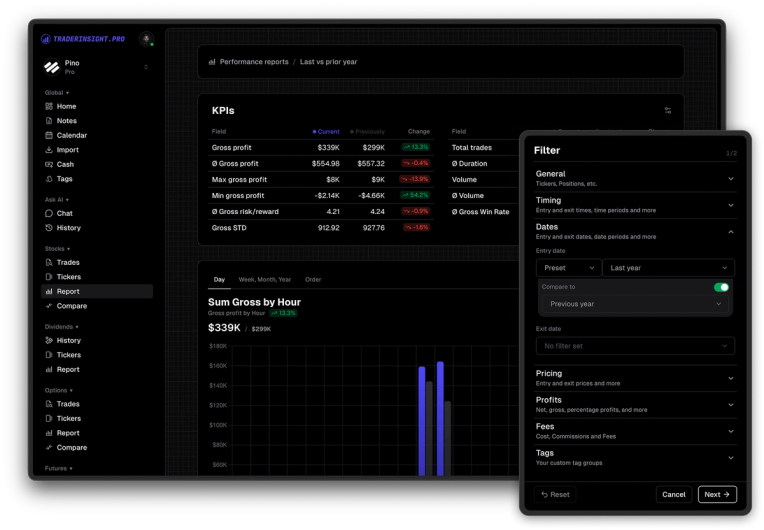
Every filter you create gets its own performance report: default stats, KPIs, and charts for that exact slice of your trading. Customize every metric and chart type, compare this quarter vs last or this year vs last, and use comparison reports when you need two or more filters side by side.
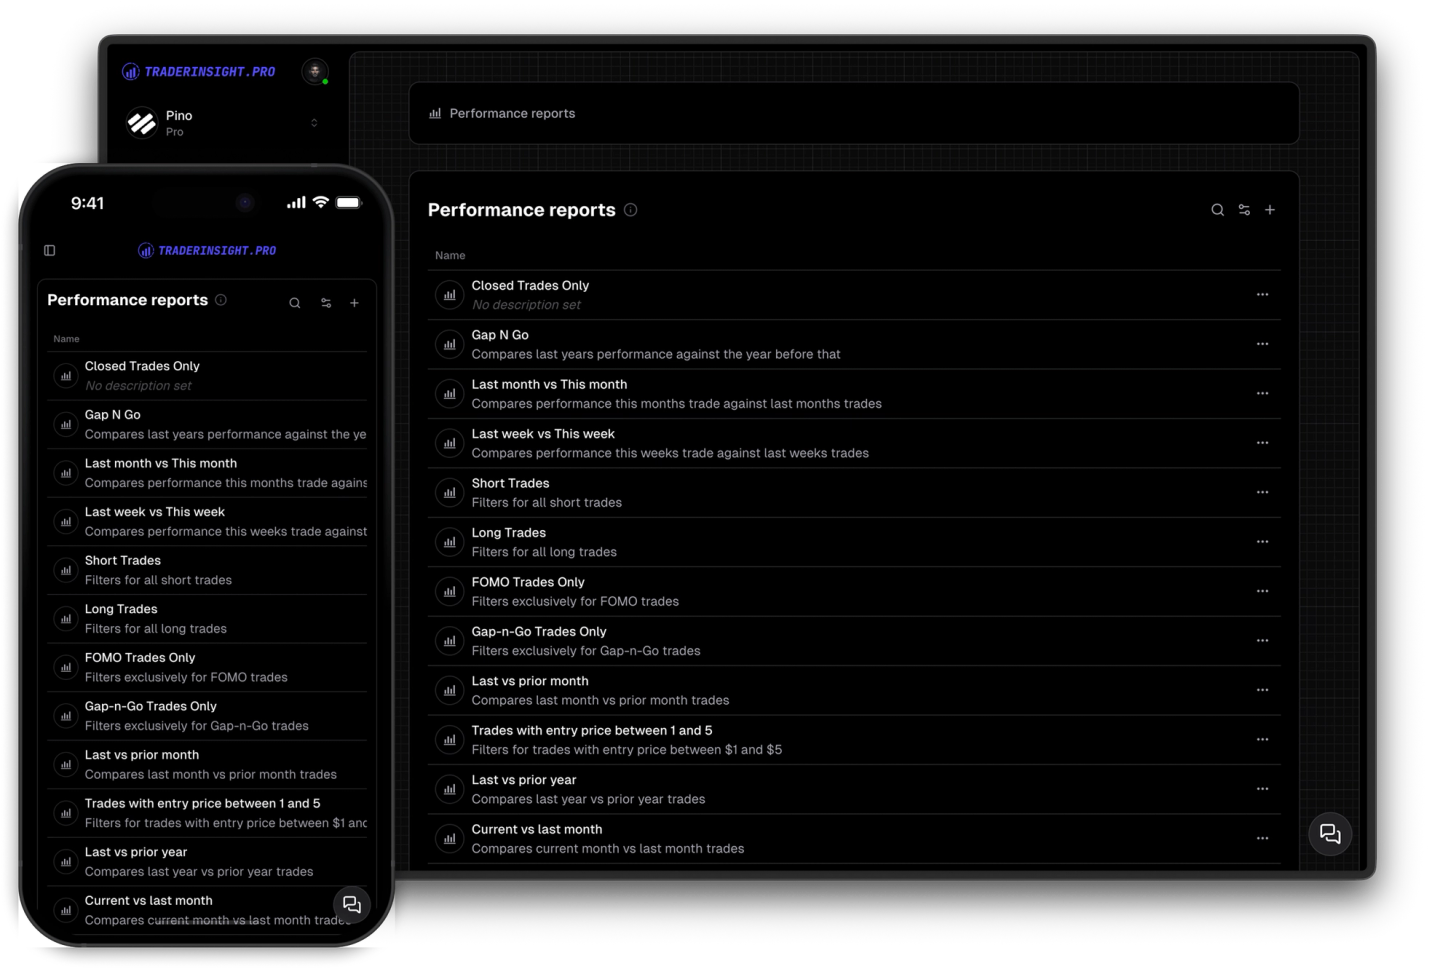
A performance report in TraderInsight.pro always starts with a filter. A filter is a saved set of conditions that defines which trades belong in the group: last 90 days where hold duration is under 6 hours, every Gap and Go tagged trade from Q1, all FOMO mistakes on high volume days, or any combination of dates, profits, tags, and trade properties you care about.
Create or save a filter and TraderInsight.pro generates a dedicated performance report for it automatically. You get a default layout with the stats, KPIs, and charts that matter most for that group: win rate, average P&L, R:R, trade count, cumulative P&L, and more. No blank dashboard to build from scratch.
From there you own the report completely. Add or remove stats and KPIs, add or remove charts, switch chart types (bar, line, scatter, bubble, polar, and more), and organize sections into tabs. When you want to see how the same filter performed across two time windows, turn on a date range comparison: this week vs last week, this quarter vs last quarter, this year vs last year, or any custom range.
When the question is not about time but about groups, use a comparison report instead. Day trades vs swing trades, Gap and Go vs Breakout vs Earnings vs Magic, or your top five strategies ranked side by side: that is what comparison reports are for. Performance reports analyze one filter deeply; comparison reports put two or more filters next to each other.
Every saved filter automatically gets a performance report. Define the trades you want: last 90 days with hold duration under 6 hours, a specific strategy tag, a mistake, a session, a ticker, or any mix of conditions. Name the filter once and the report is ready to open.
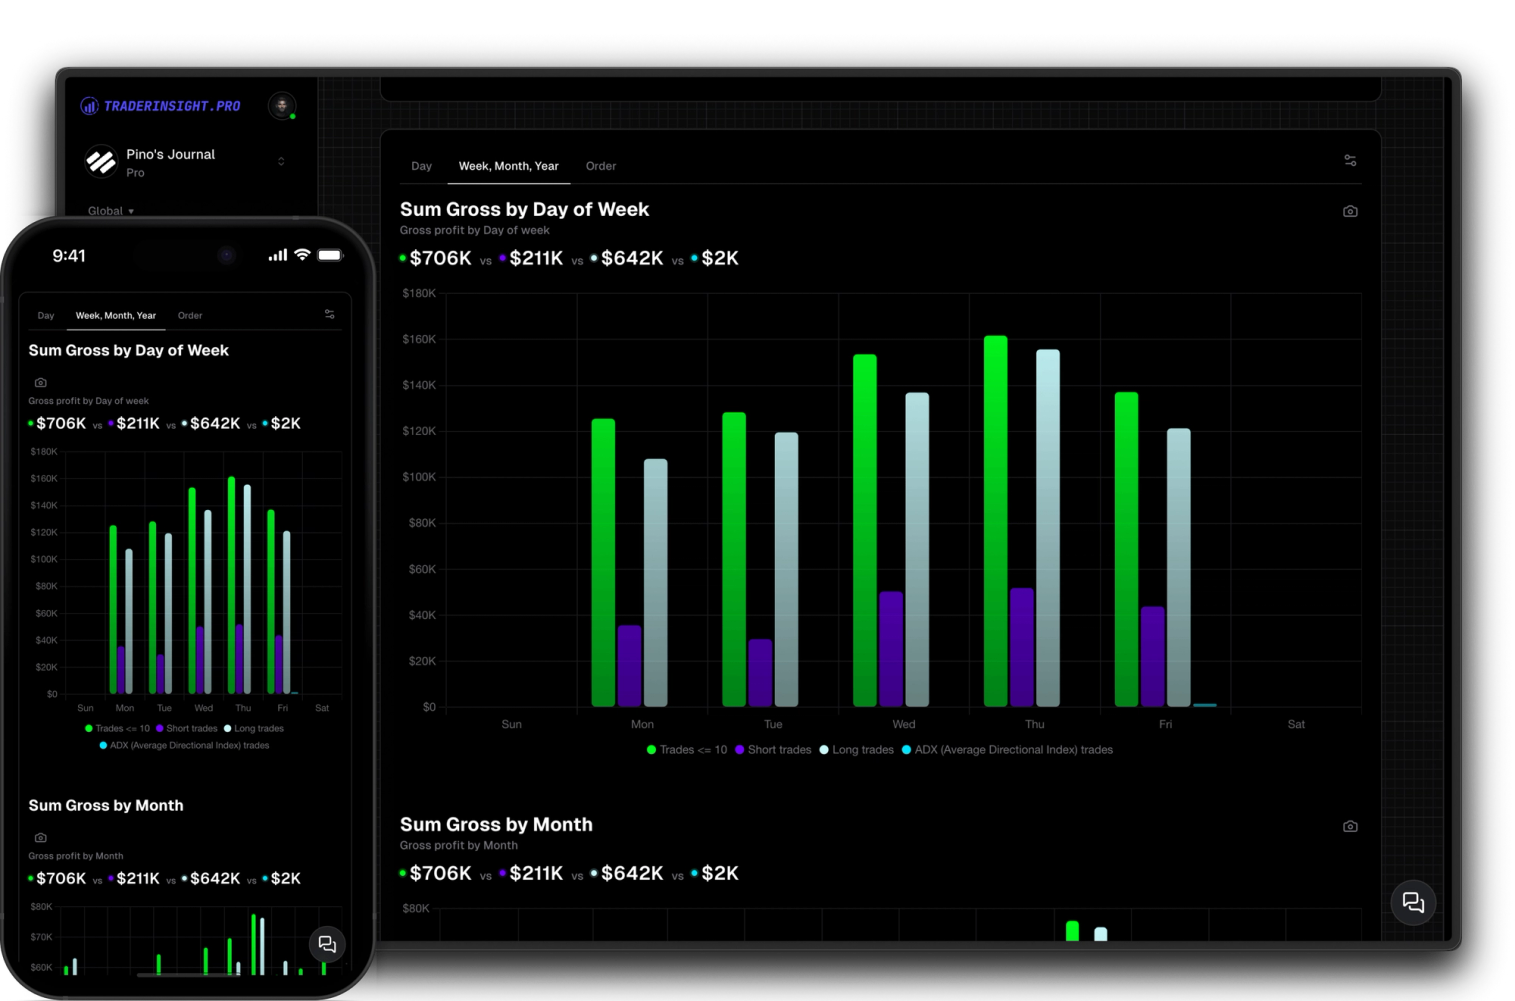
Open any filter's report and you immediately see stats, KPIs, and charts scoped to exactly those trades. Win rate, gross and net P&L, average win and loss, R:R, trade count, hold duration breakdowns, and visual charts that summarize how that slice of your journal is performing. The defaults are strong enough to review on day one; customization comes when you know what you want to emphasize.
Add or remove any stat or KPI, add or remove charts, change chart types (bar, line, scatter, bubble, polar, and more), and organize everything into tabs. Each report is independent: your day trade filter can show session KPIs while your swing filter shows hold duration and sector breakdowns. You decide what appears, not a fixed template.
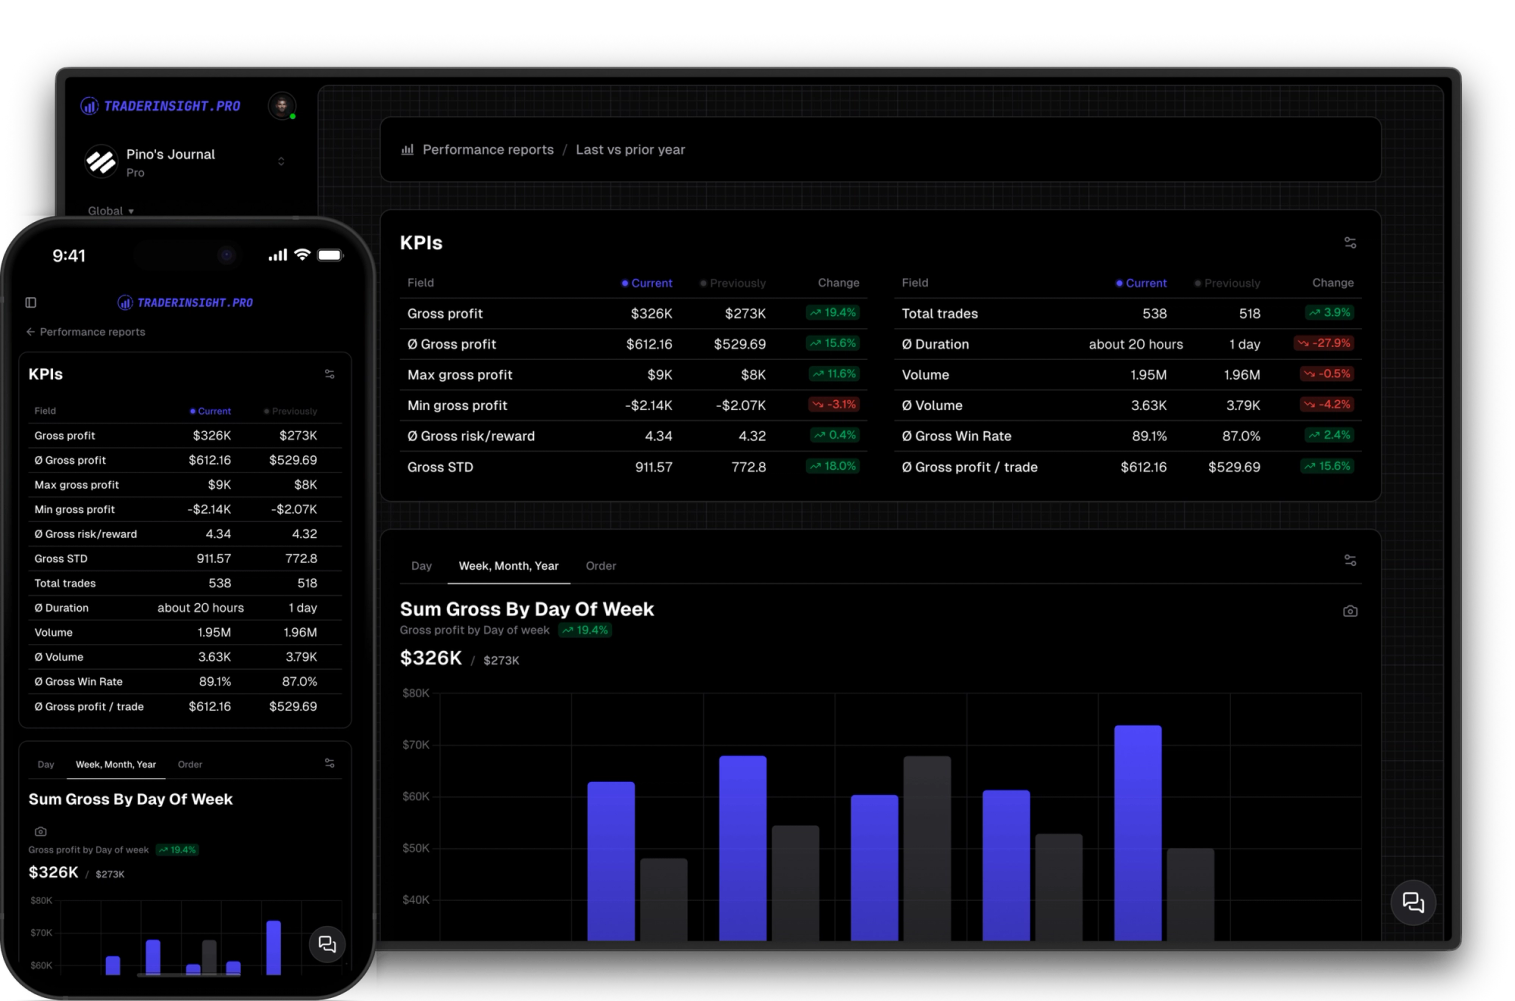
Turn on date range comparison inside a performance report to split the same filter across two periods. Compare this week vs last week, this quarter vs last quarter, this year vs last year, or any custom date range you define. KPIs show both values with the percentage change between them; charts render two datasets so you can see exactly when performance shifted.
Use a performance report when you are analyzing one group over time. Use a comparison report when you want two or more filters ranked side by side: day trades vs swing trades, Gap and Go vs Breakout vs Earnings vs Magic, or your top strategies and worst mistakes in a single view. Stack the filters, get default KPIs and charts for each group, then customize the report the same way you would a performance report.
Start with one filter per question you care about. Let the default report answer it, customize only what you need, compare periods when you want to track progress, and pull multiple filters into a comparison report when you need to rank groups against each other.
Discover answers to frequently asked questions right here. If you can't find what you're looking for then reach out.
Automatically from a filter. Every saved filter generates a dedicated performance report for that group of trades. Example: last 90 days where hold duration is under 6 hours, or every trade tagged with a specific strategy. Name the filter and the report is ready immediately.
Stats, KPIs, and charts scoped to the filter: win rate, P&L, R:R, trade count, cumulative performance charts, and more. You can use the defaults as-is or customize every element.
Any property on your trades: dates, hold duration, profit range, ticker, strategy and mistake tags, market condition, time of day, volume, and more. Combine conditions in one filter, such as last 90 days + hold duration under 6 hours + a specific setup tag.
Yes, fully. Add or remove stats and KPIs, add or remove charts, change chart types (bar, line, scatter, bubble, polar, and more), and organize sections into tabs. Each report is independent.
Select two periods for the same filter: this week vs last week, this quarter vs last quarter, this year vs last year, or custom dates. KPIs show both values with percentage change; charts render two datasets so you can see when performance shifted.
A performance report analyzes one filter, including comparing that filter across two time periods (for example this quarter vs last quarter). A comparison report takes two or more filters and shows their metrics side by side, useful when you want day trades vs swing trades or Gap and Go vs Breakout vs Earnings ranked in one view.
Yes. Create one filter for day trades and one for swing trades, then add both to a comparison report to see win rate, P&L, R:R, and other metrics side by side.
Yes. Filters and their reports stay linked. Any change to a filter's conditions is reflected in its performance report, comparison reports that use it, and your filtered trade list.
Performance reports are persistent, customizable views tied to saved filters you revisit anytime. AI answers ad hoc questions in plain English. Many traders explore with AI first, then save the slice as a named filter with its own report.
Harness the power of comparisons to optimize your trading. Easily compare your custom filters, not just strategies, to identify what works best for you.

Access all features seamlessly across your main machine and your mobile device with our downloadable apps. Enjoy full functionality wherever you go.
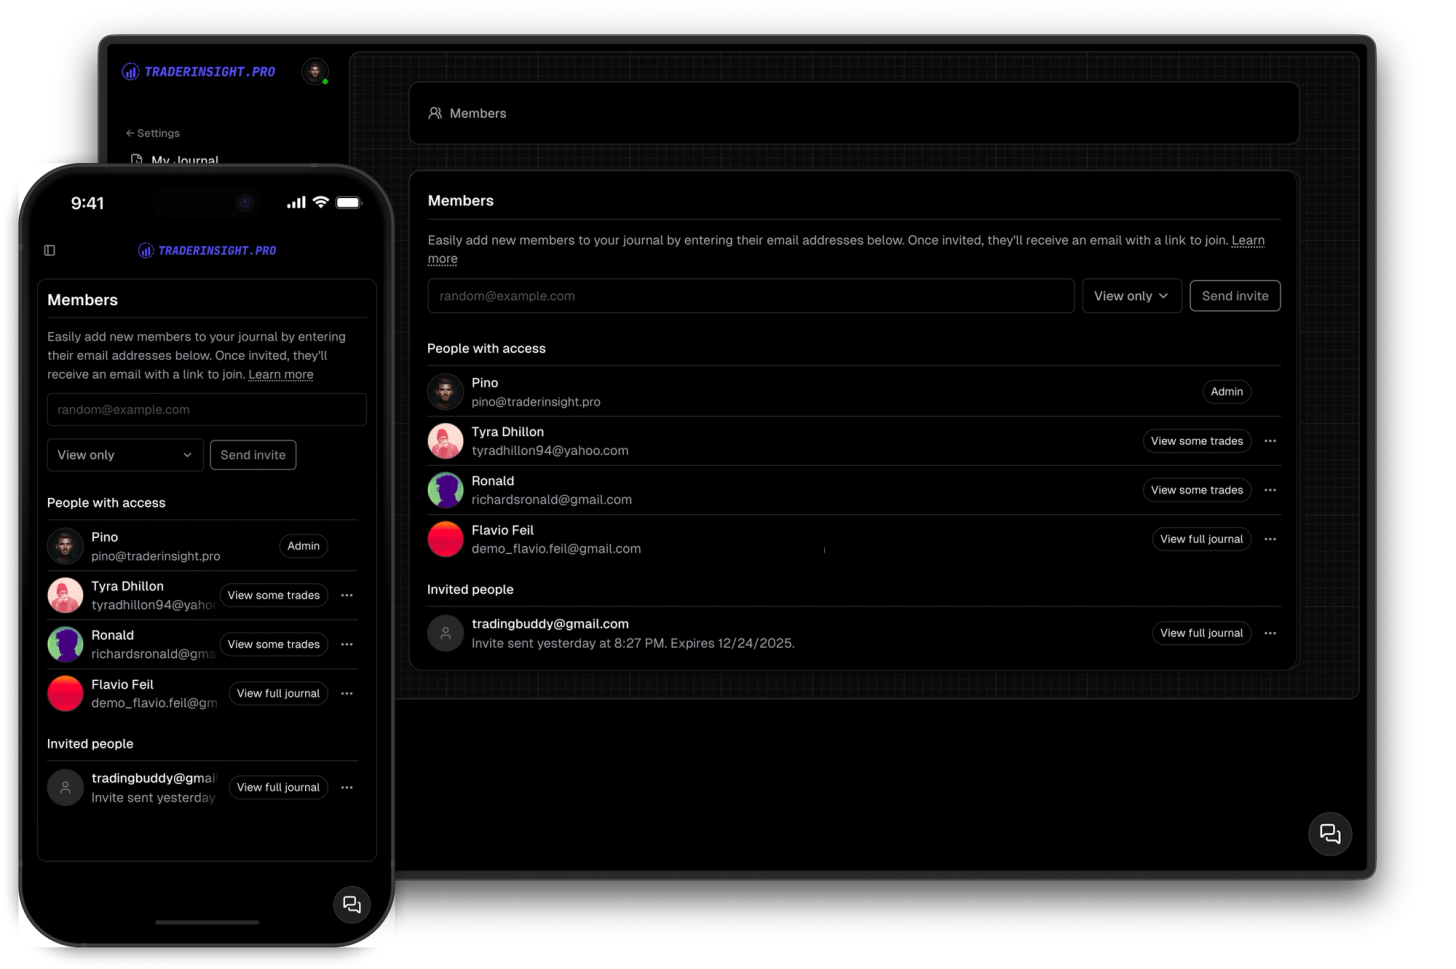
Share your journal with your friends, teammates, mentors or mentees so tha they can follow your trading journal.