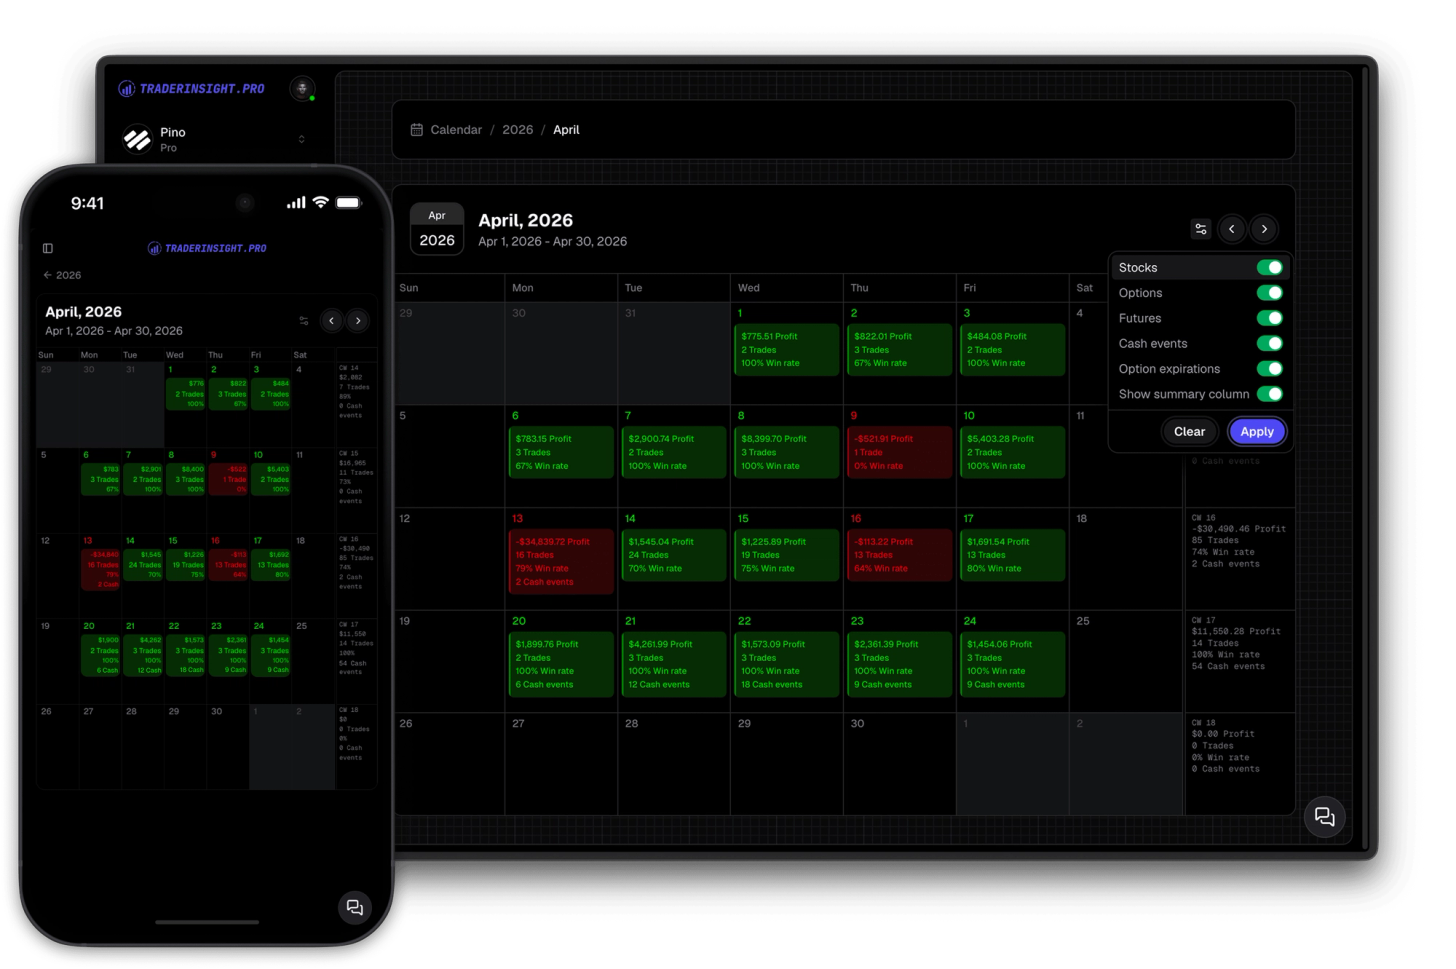
Trading Calendar
See your trading performance at a glance
Gain comprehensive insights into your trading history with yearly and monthly summaries. Dive deeper into specific days with just a single click.
Most traders can tell you roughly which strategies they use. Very few can tell you which ones are actually profitable, how often they execute them correctly, or what their average P&L per strategy looks like over the last 90 days. The data exists - it's just never been organized in a way that makes it answerable.
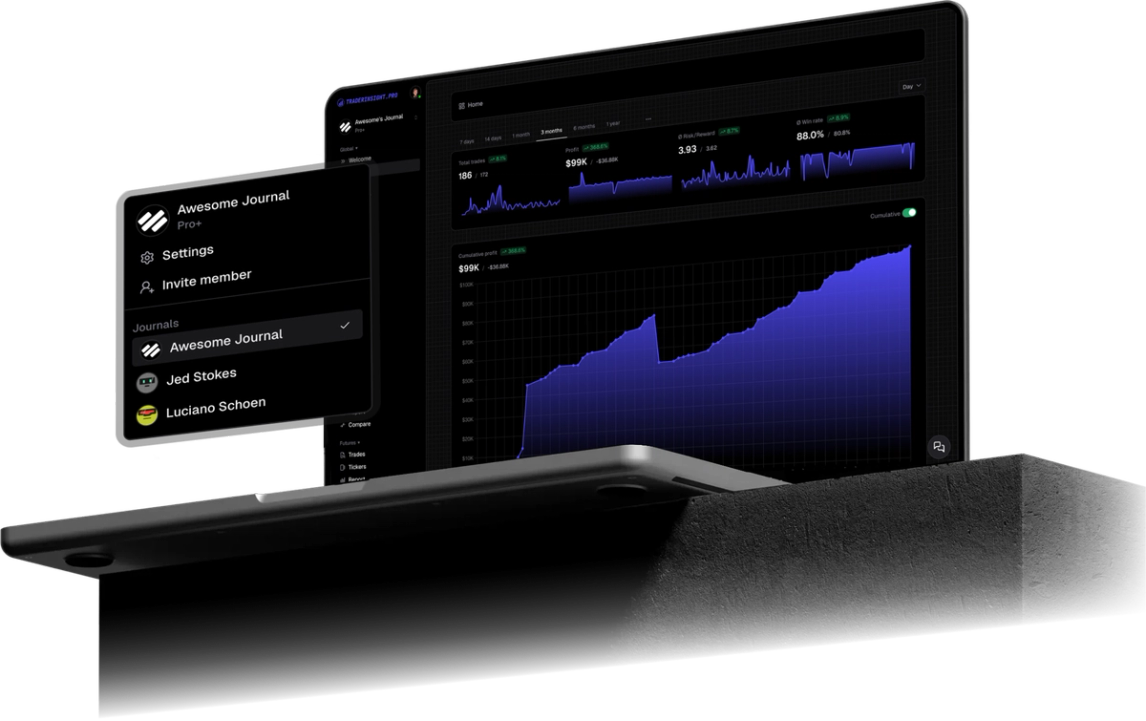
Tags in TraderInsight.pro are how you organize that data. You define the structure - tag groups like Strategies, Mistakes, Market Conditions, Learnings, or anything else that matters to you - and within each group you create the tags that fit your trading. Every tag can have a name and an optional description so the labels stay consistent and mean the same thing six months from now.
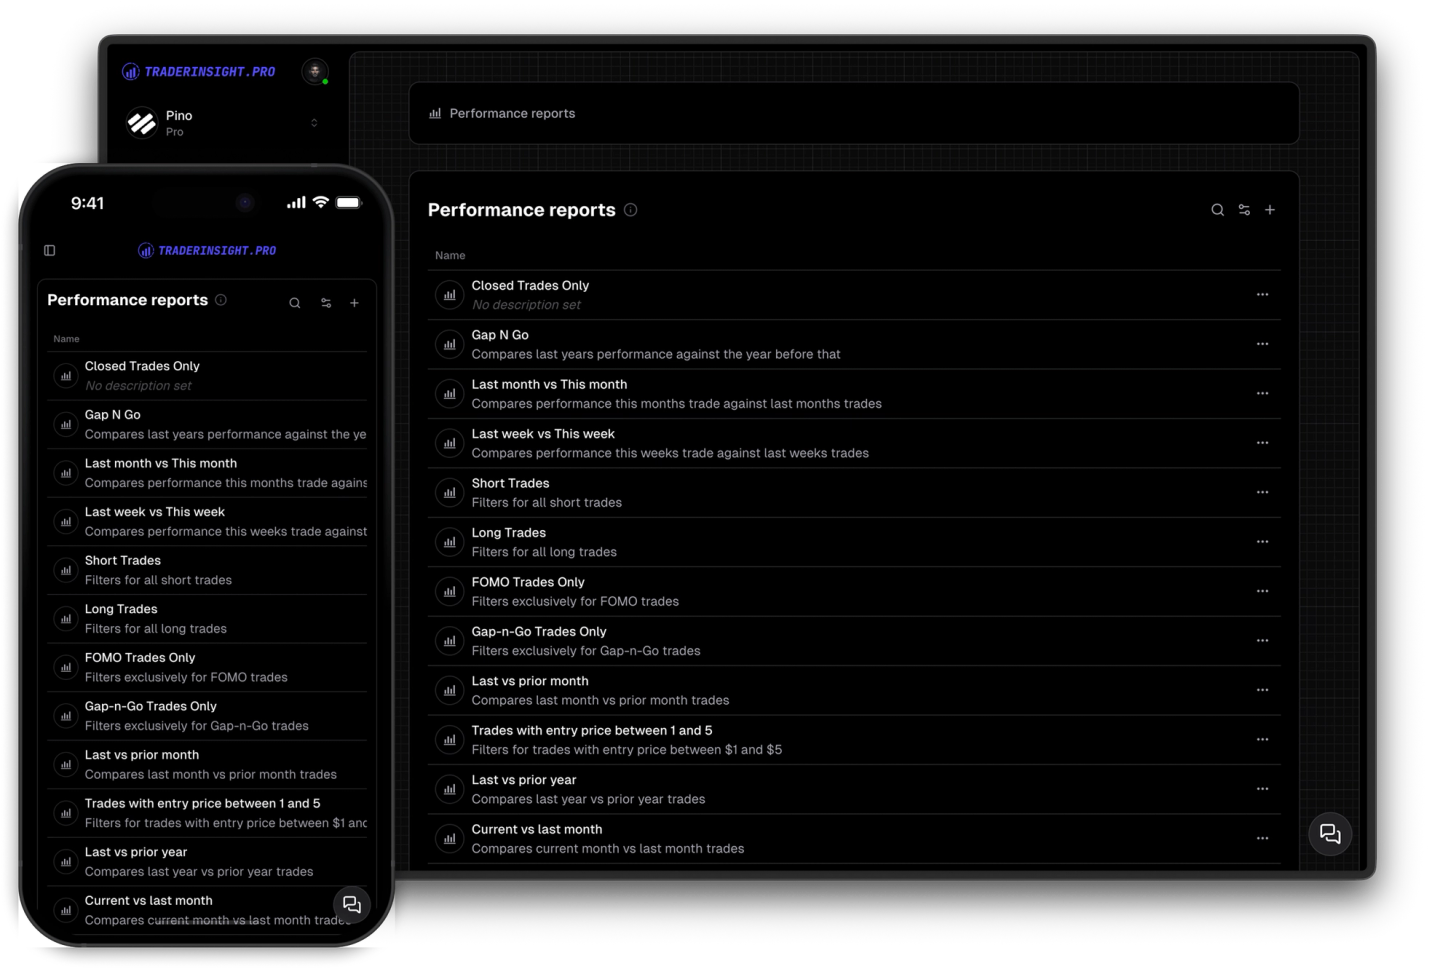
Once tags are attached to trades, everything else unlocks. Filter your trade list by any tag or combination of tags. Build performance reports and comparison reports scoped to specific tags. And every tag group gets its own dedicated reporting area - with usage stats, gross and net profit per tag, and a chart you can view cumulatively or across any time window you choose.
Create tag groups for whatever dimensions matter to your trading - Strategies, Mistakes, Market Conditions, Execution, Mindset, or anything else. Add tags within each group with a name and optional description.
Tag the strategy you traded, the mistake you made, the market condition you were in. Every trade goes from a row of numbers to something you can actually learn from - with a clear 'why' behind every entry and exit.
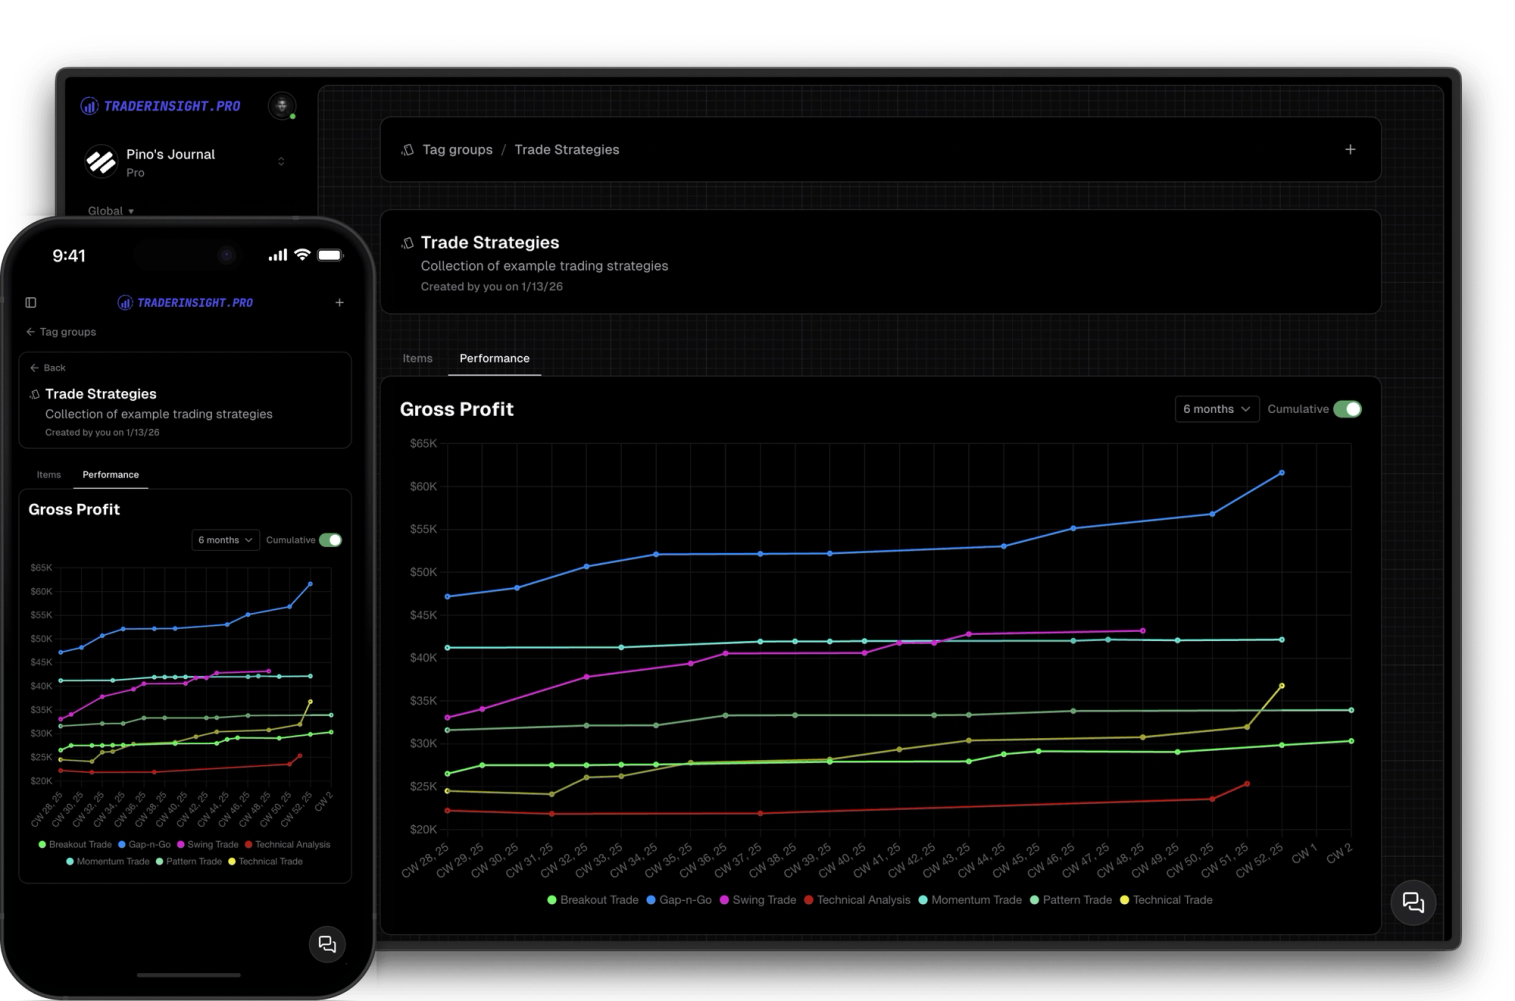
Each tag group has a dedicated page showing performance across every tag within it - usage count, gross profit, net profit, and a chart per tag. View results cumulatively or filtered to the last X weeks, months, or years. It's the fastest way to see which strategies are carrying your account and which mistakes are costing you the most.
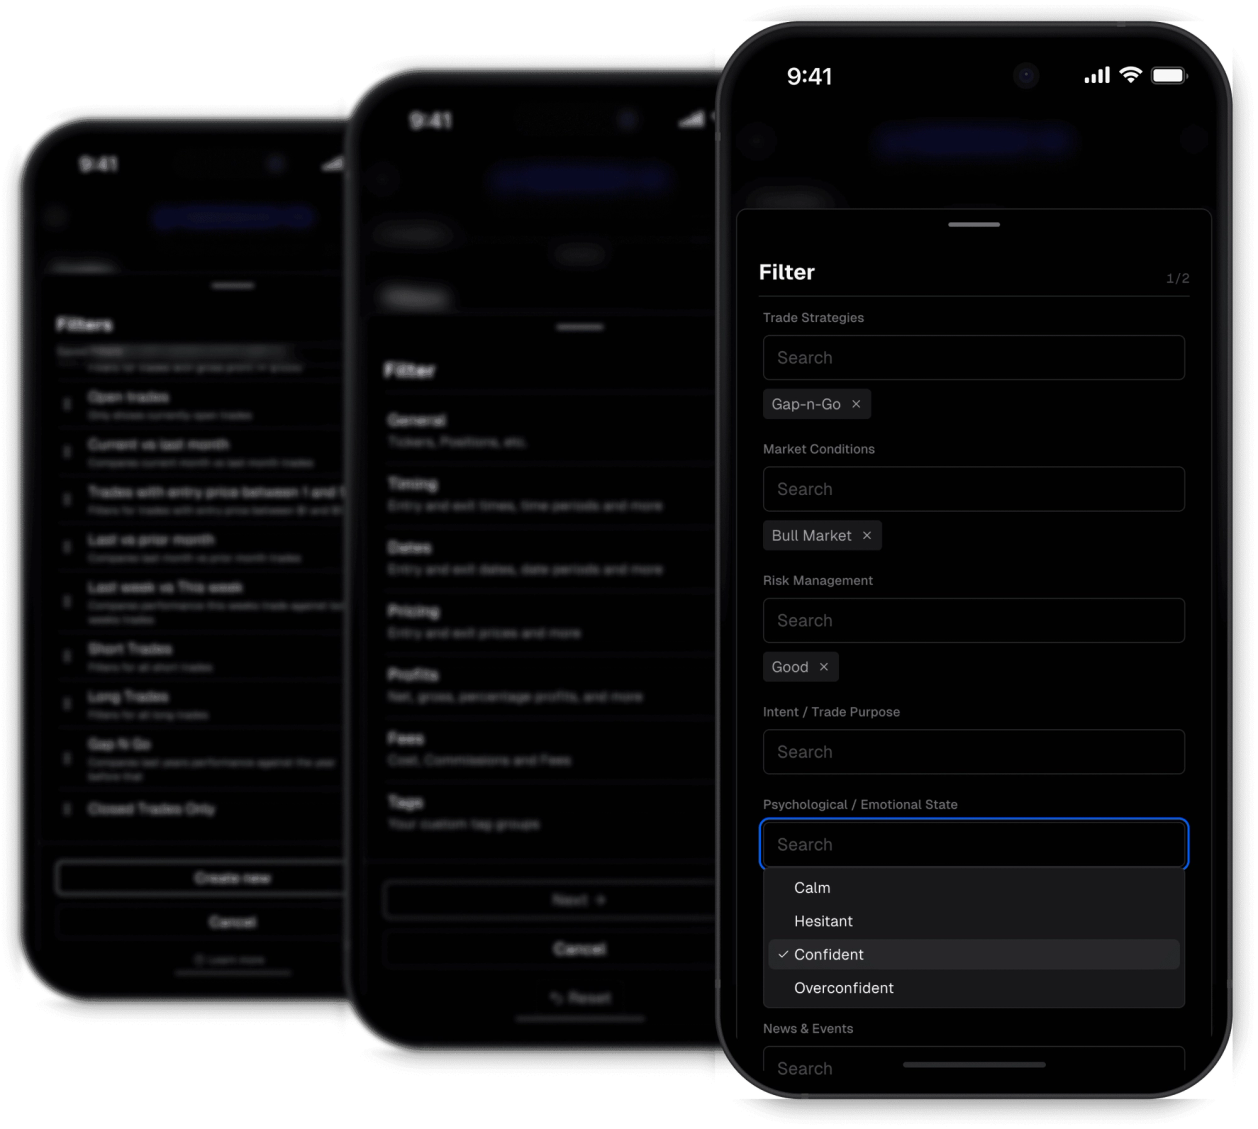
Every tag you create becomes a filter condition. Use it to filter your trade list, create a performance report scoped to that tag, or pull it into a comparison report alongside other tags. Your tagging system becomes the foundation of everything you analyze.
Discover answers to frequently asked questions right here. If you can't find what you're looking for then reach out.
A tag group is a category you define - like Strategies, Mistakes, or Market Conditions. Within each group you create individual tags. For example, a Strategies group might contain tags like Breakout, Pullback, and Momentum.
Every tag group you create gets its own dedicated reporting page showing performance across all tags within it - usage count, gross profit, net profit, and a per-tag chart. You can view results cumulatively or filtered to any time window.
As many as you need. The exact limit depends on your membership tier - build the structure that fits how you actually think about your trading.
Yes. Build a filter with multiple tag conditions - for example, a specific strategy and a specific market condition - and apply it to your trade list, performance reports, or comparison reports.
A tag group is the category - like Strategies. A tag is the individual label within it - like Breakout or Pullback. Every tag belongs to exactly one tag group.
Yes. Every tag supports an optional description so you can define exactly what it means. Useful for keeping your labels consistent over time, especially as your trade history grows.
Yes. Tags can be attached to trades across all asset types - stocks, options, futures, crypto, forex, and more.
Yes. Every tag is available as a filter condition, and every filter automatically generates a performance report. Pull multiple tag-based filters into a comparison report to rank strategies or mistakes side by side.
Gain comprehensive insights into your trading history with yearly and monthly summaries. Dive deeper into specific days with just a single click.
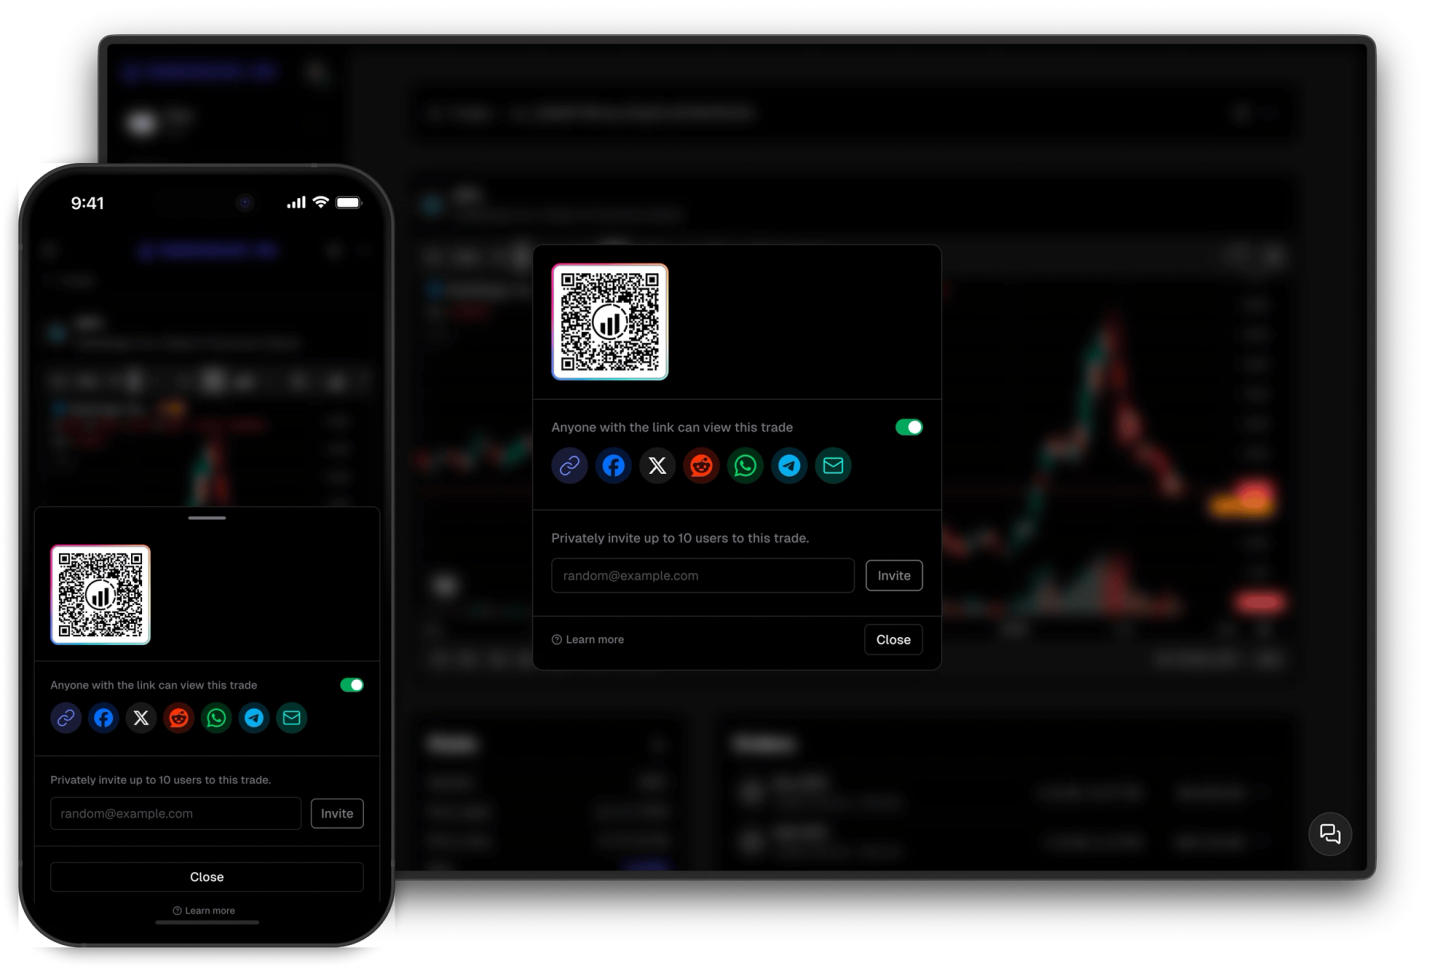
Share your trades privately with selected individuals or showcase them to the world with ease.
Uncover valuable insights into your trading behavior, strategies, and common pitfalls. Gain valuable insights and enhance your trading.