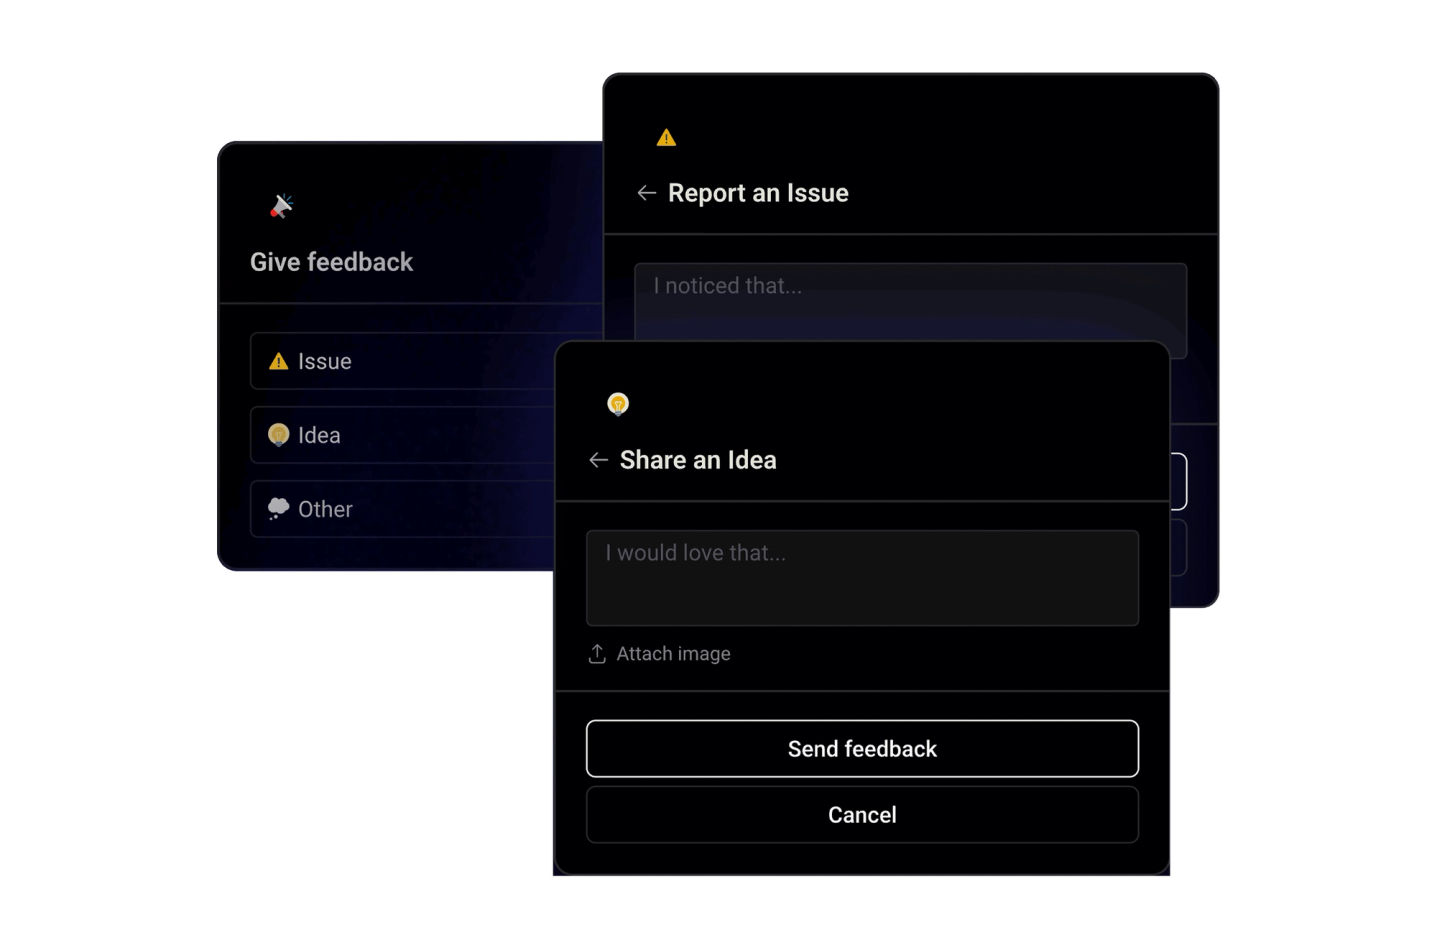
Share your feedback
Shape the future of your trading journal
Shape the future of your trading journaling experience by sharing your ideas, suggestions, or critiques directly within the app. Your feedback drives our continuous improvement efforts.
Raw trade data is noise. Ten thousand rows of entries, exits, and P&L numbers tell you nothing on their own - the insight is always in a specific subset. The trades you took on Mondays. The ones where you held longer than an hour. Every FOMO mistake from last quarter. Your Breakout strategy on high-volume days.
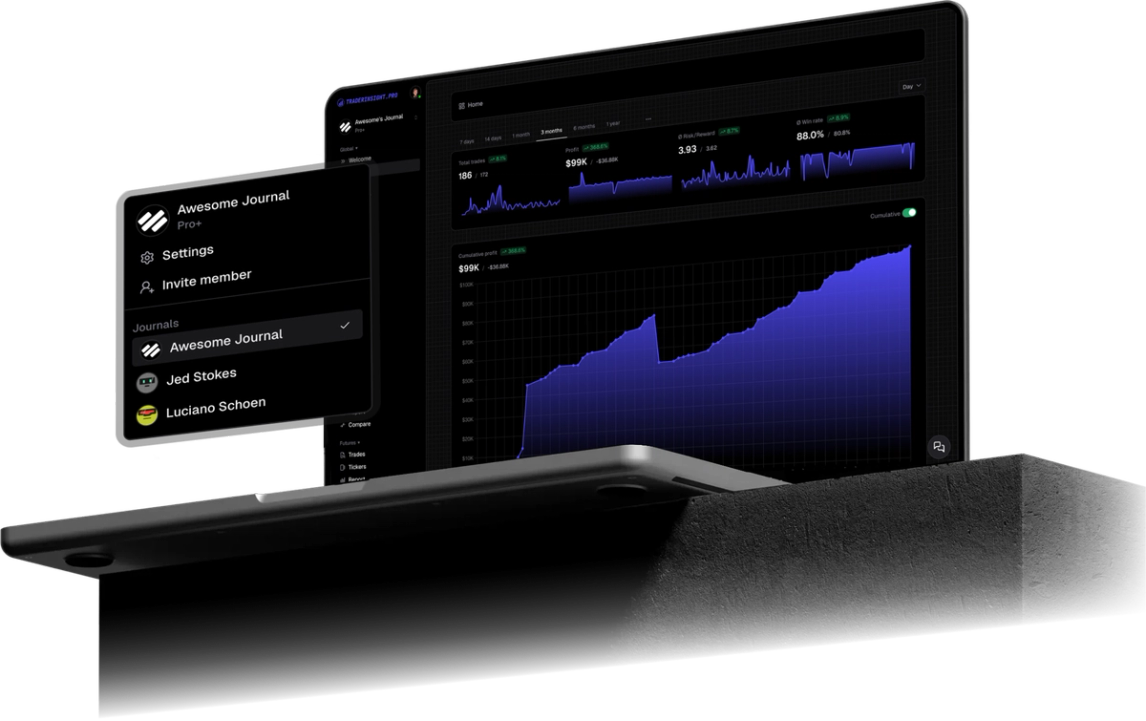
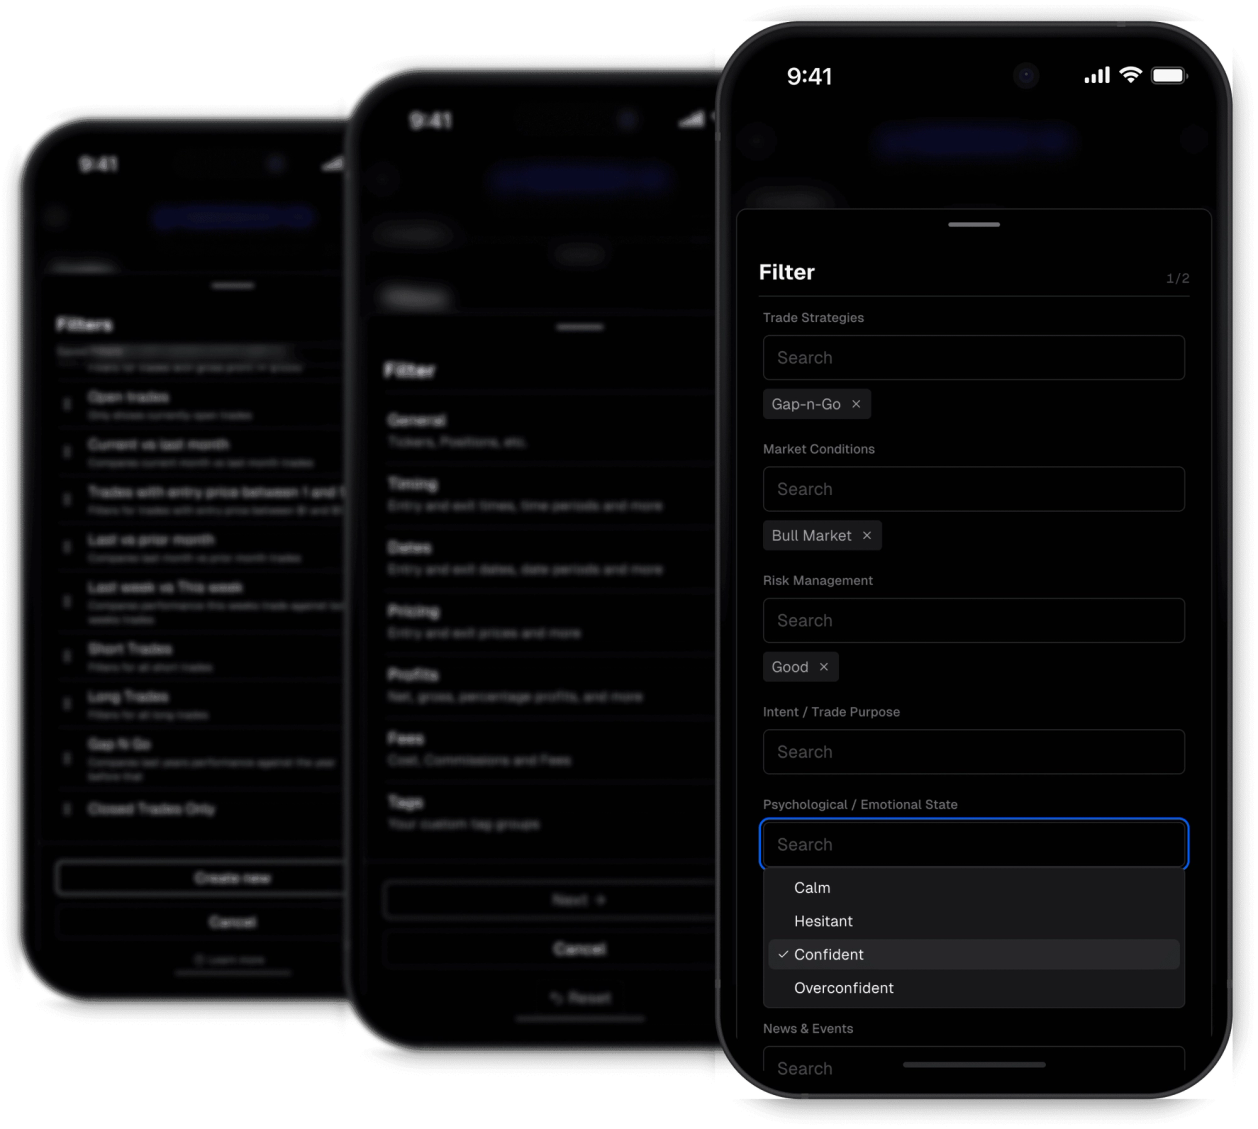
Filters in TraderInsight.pro let you define exactly that subset - any combination of properties across dates, profits, prices, tickers, sides, statuses, and your own custom tags - and save it with a name so you can reuse it anywhere. Apply it to your trade list to review matching trades, attach it to a performance report to analyze that group over time, or use it in a comparison report to stack it against another filter.
Every filter is scoped to an asset class. Your stocks filters live with your stocks, your options filters with options, your futures filters with futures. The properties available always match the asset you're working with, so filters stay relevant and your reports stay clean.
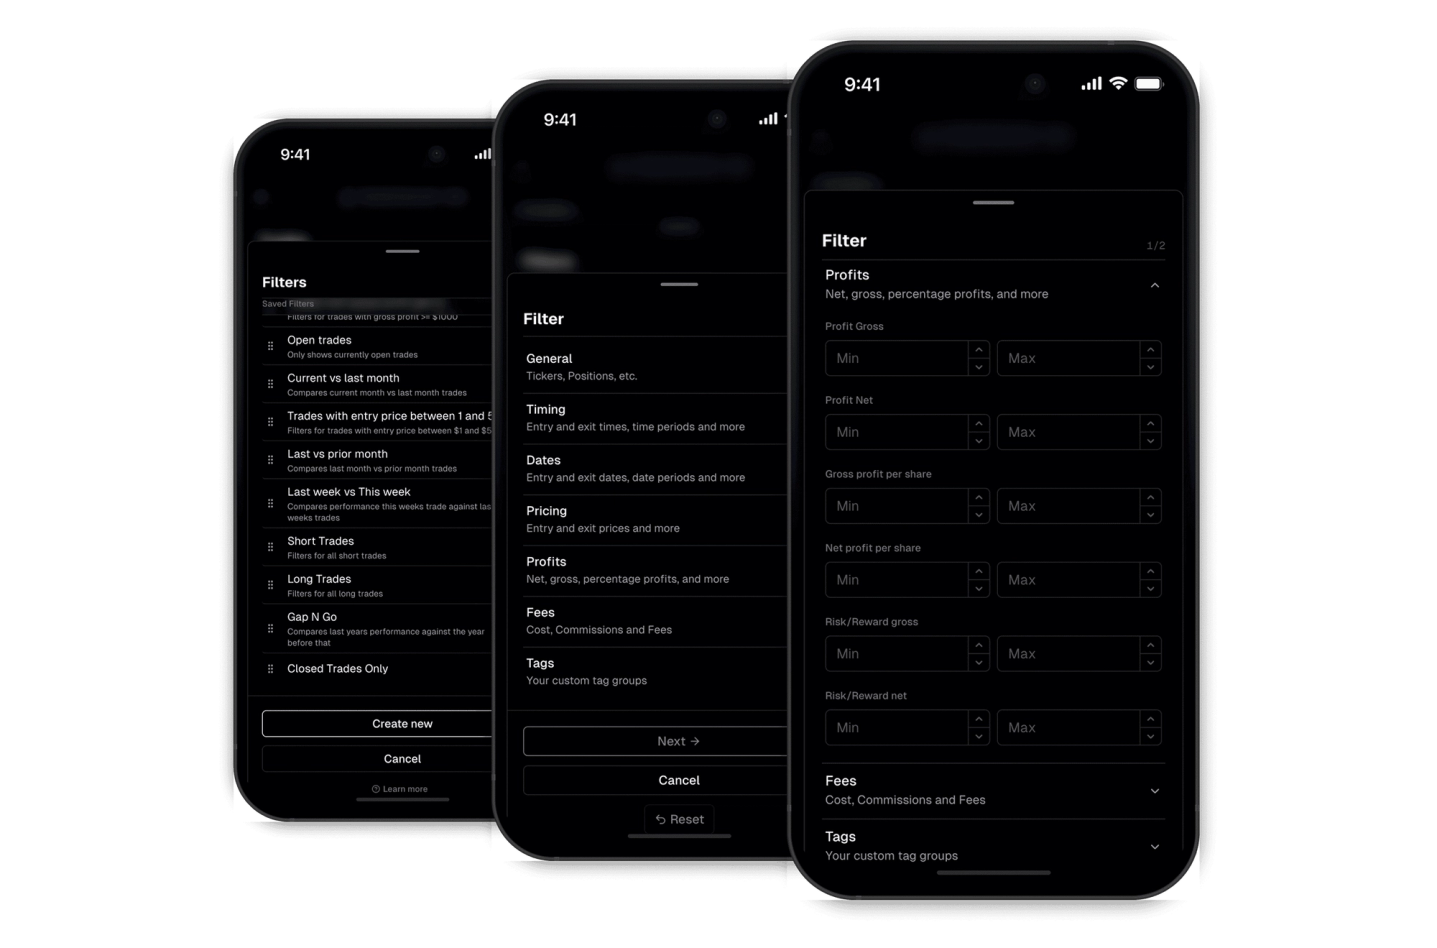
Date and time, entry and exit price, hold duration, gross and net profit, per-share profit, tickers, side, status, stop and target levels - every property is available as a filter condition. Properties are organized into groups so finding what you need is fast, even when you're building complex filters.
Every tag group and tag you've created is available as a filter condition. Filter for a specific strategy, a specific mistake, a combination of both, or any other dimension you track.
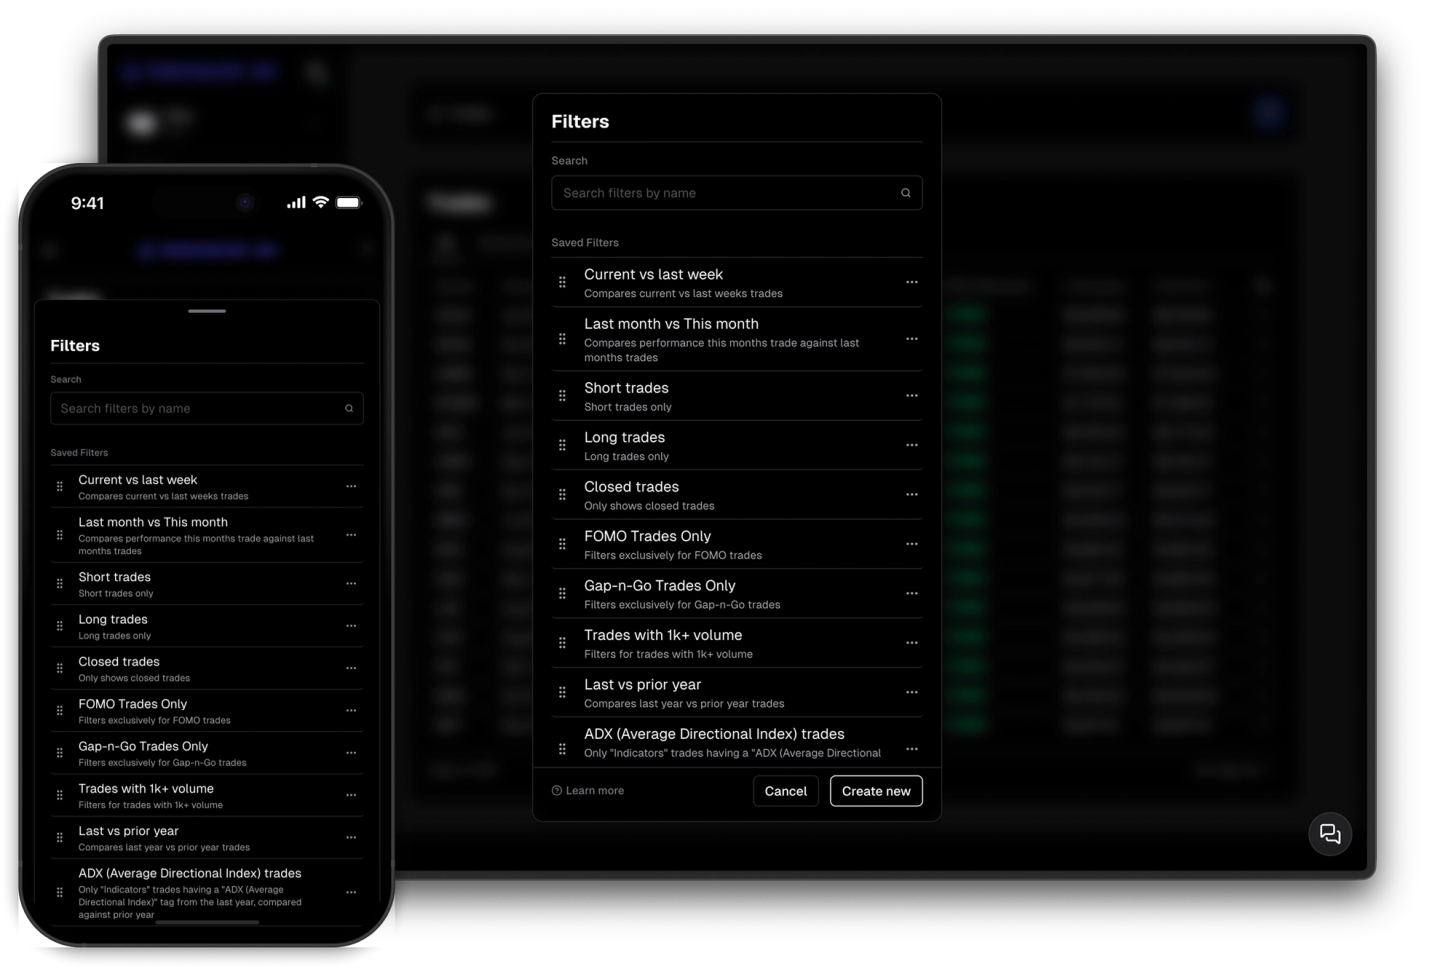
Give a filter a name and an optional description and it's saved. Apply it to your trade list to review matching trades, use it to generate a performance report, or pull it into a comparison report alongside other filters.
Filters are the foundation of everything else in TraderInsight.pro. They let you define exactly the trades you want to analyze, and then use them to generate performance reports and comparison reports.
Discover answers to frequently asked questions right here. If you can't find what you're looking for then reach out.
Any property on your trades - entry and exit date and time, hold duration, gross and net profit, per-share profit, entry and exit price, stop and target levels, tickers, side, status, and all your custom tags and tag groups - pretty much everything is filterable.
Yes. Every filter is tied to an asset class - stocks, options, futures, and more. The properties available always match the asset you're working with. The dashboard allows checking the performance across all main asset types.
Yes. Save a filter once and apply it to your trade list, attach it to a performance report, or use it in a comparison report. The same filter works everywhere.
Yes. Every tag group and tag you've created is available as a filter condition - strategies, mistakes, market conditions, or any other dimension you track.
Yes. Edit any saved filter at any time. Changes are reflected everywhere the filter is used - trade list, performance reports, and comparison reports.
A filter defines a group of trades based on conditions you set. A performance report takes that filter and shows you the analytics for that group - win rate, P&L, R:R, and more - including date range comparisons.
Yes. Combine as many conditions as you need - for example, a specific strategy tag, a minimum hold duration, and a profit range - to narrow down exactly the trades you want to analyze.
Shape the future of your trading journaling experience by sharing your ideas, suggestions, or critiques directly within the app. Your feedback drives our continuous improvement efforts.
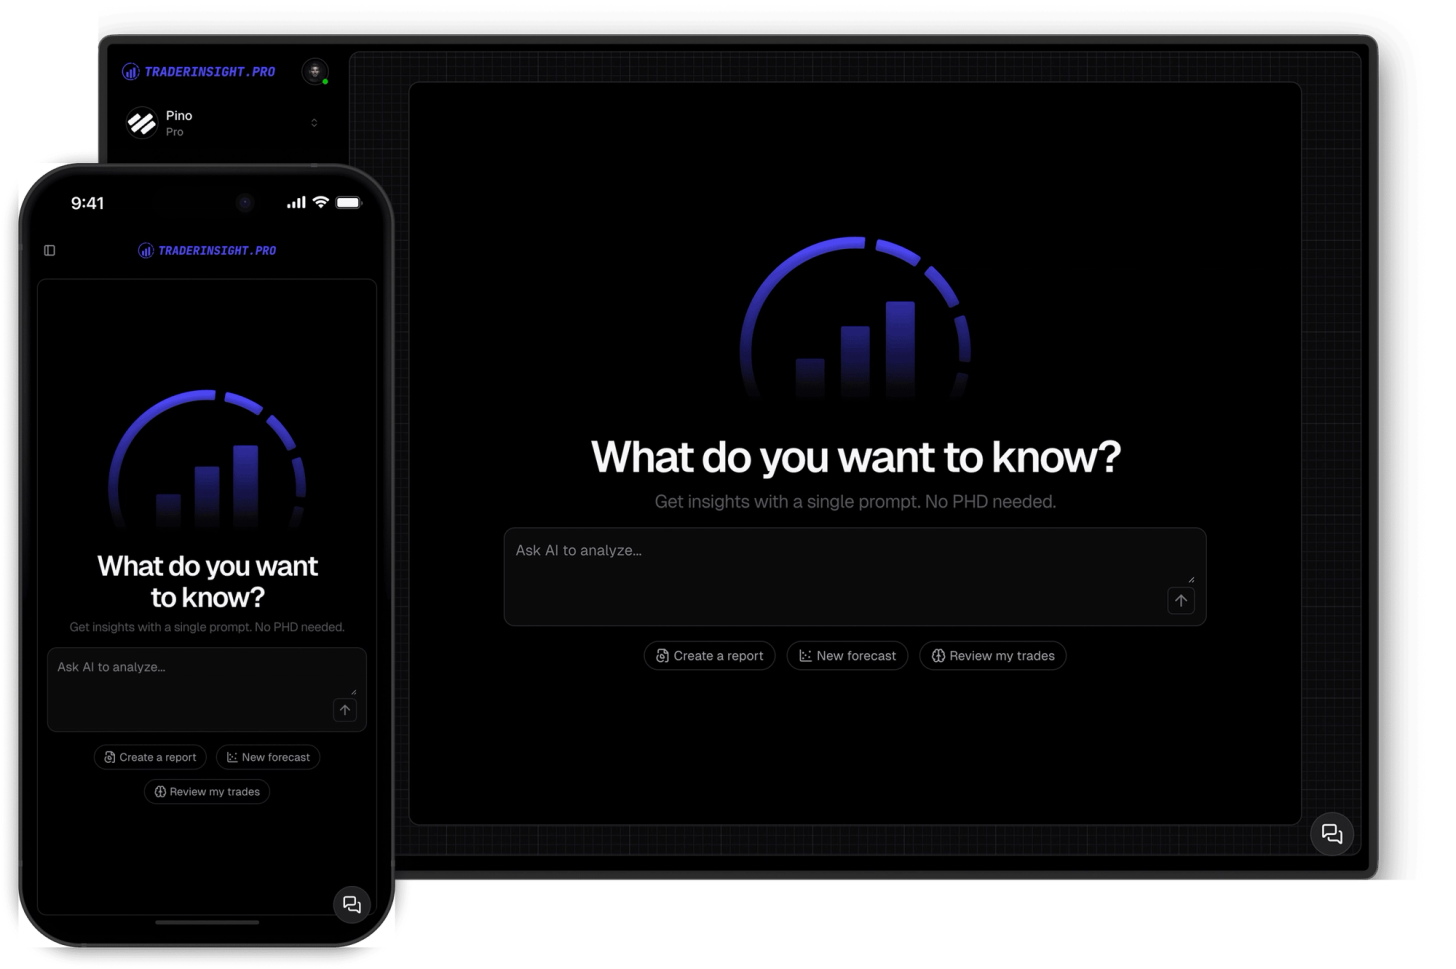
Chat with your journal. Query your trades, strategies and more. Built reports, get insights and more with AI.
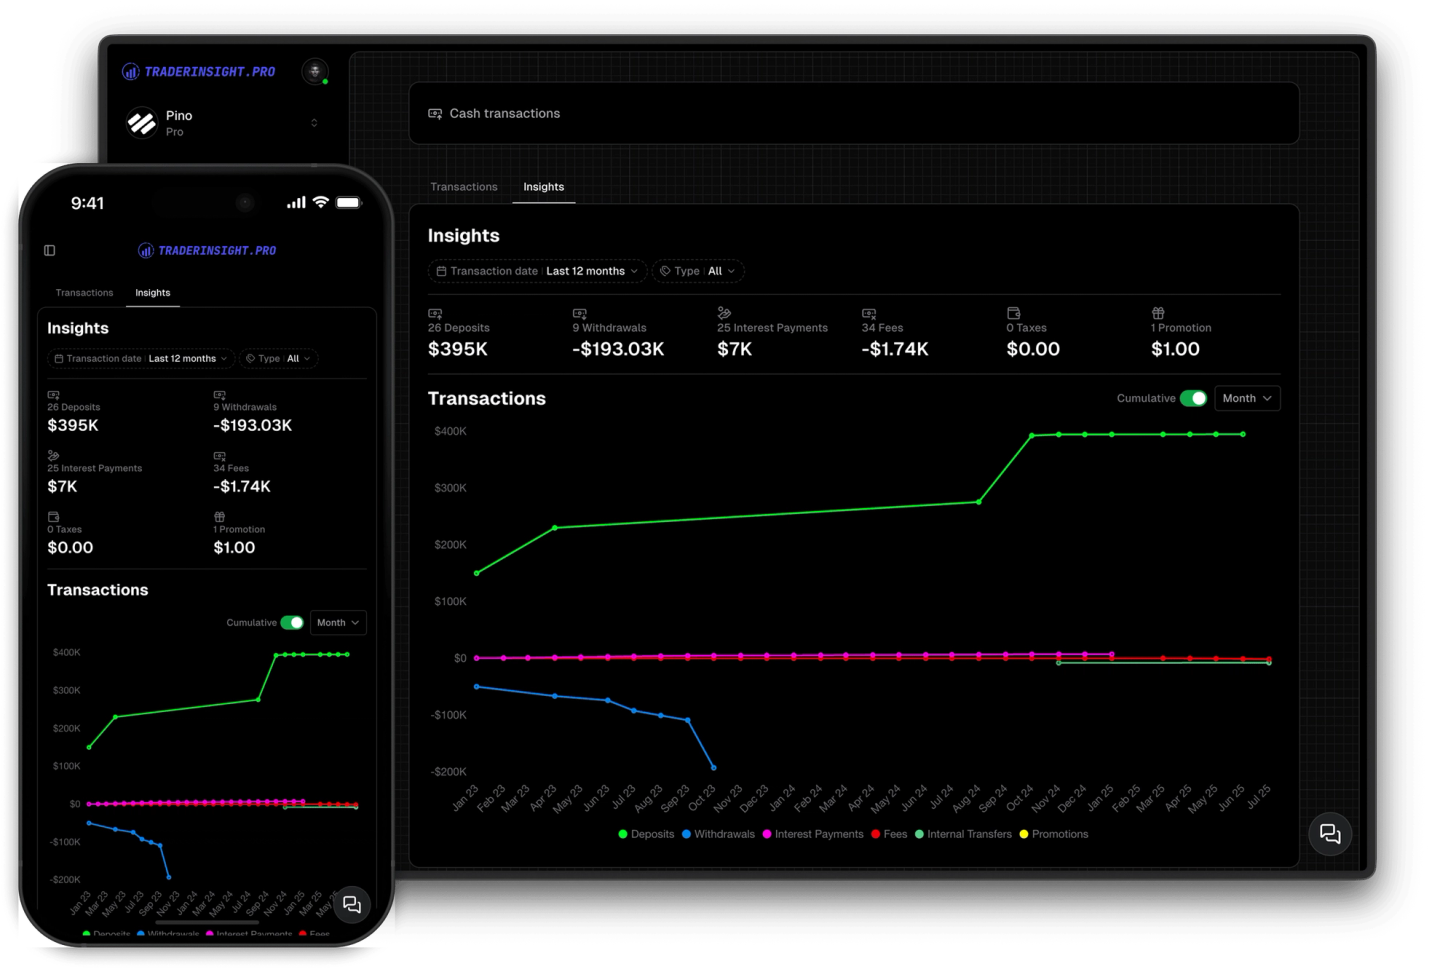
Track your cash balances and transactions. Get insights into your cash flow and performance.