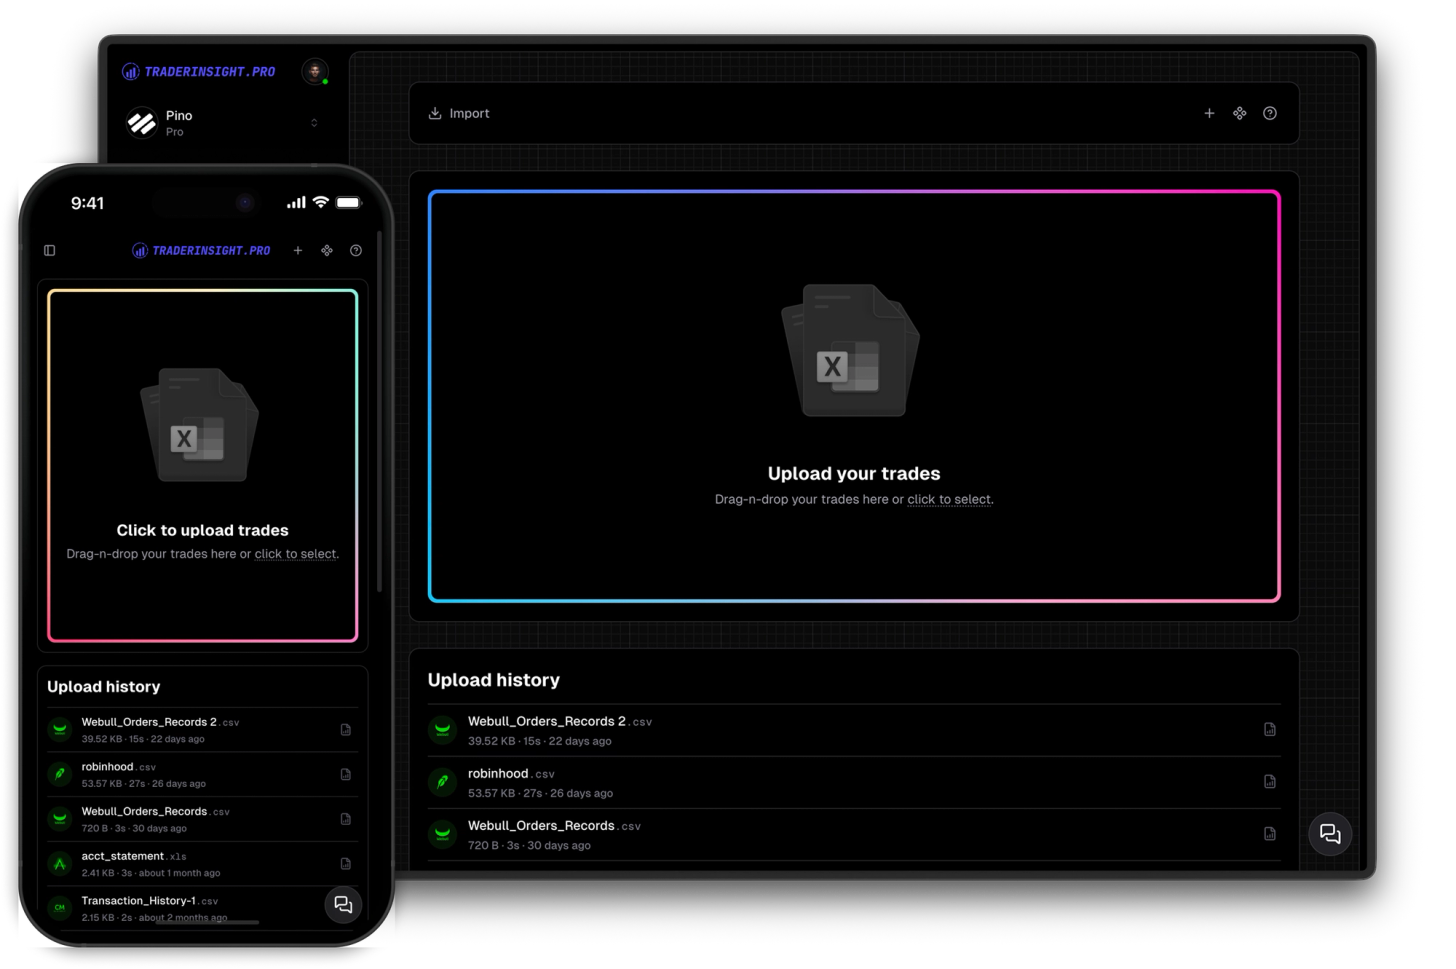
Import anything
Import trades from any broker in seconds
Journaling starts with data. You can import from countless brokers through simple auto-sync and drag-and-drop. And if your broker is not yet supported, we can add it in a few clicks.
Every symbol in your journal is a live link. Click any ticker and instantly see a live price chart, company fundamentals, analyst buy/sell/hold ratings, dividend schedule, top news - and your own P&L and win rate for that symbol, all in one place.
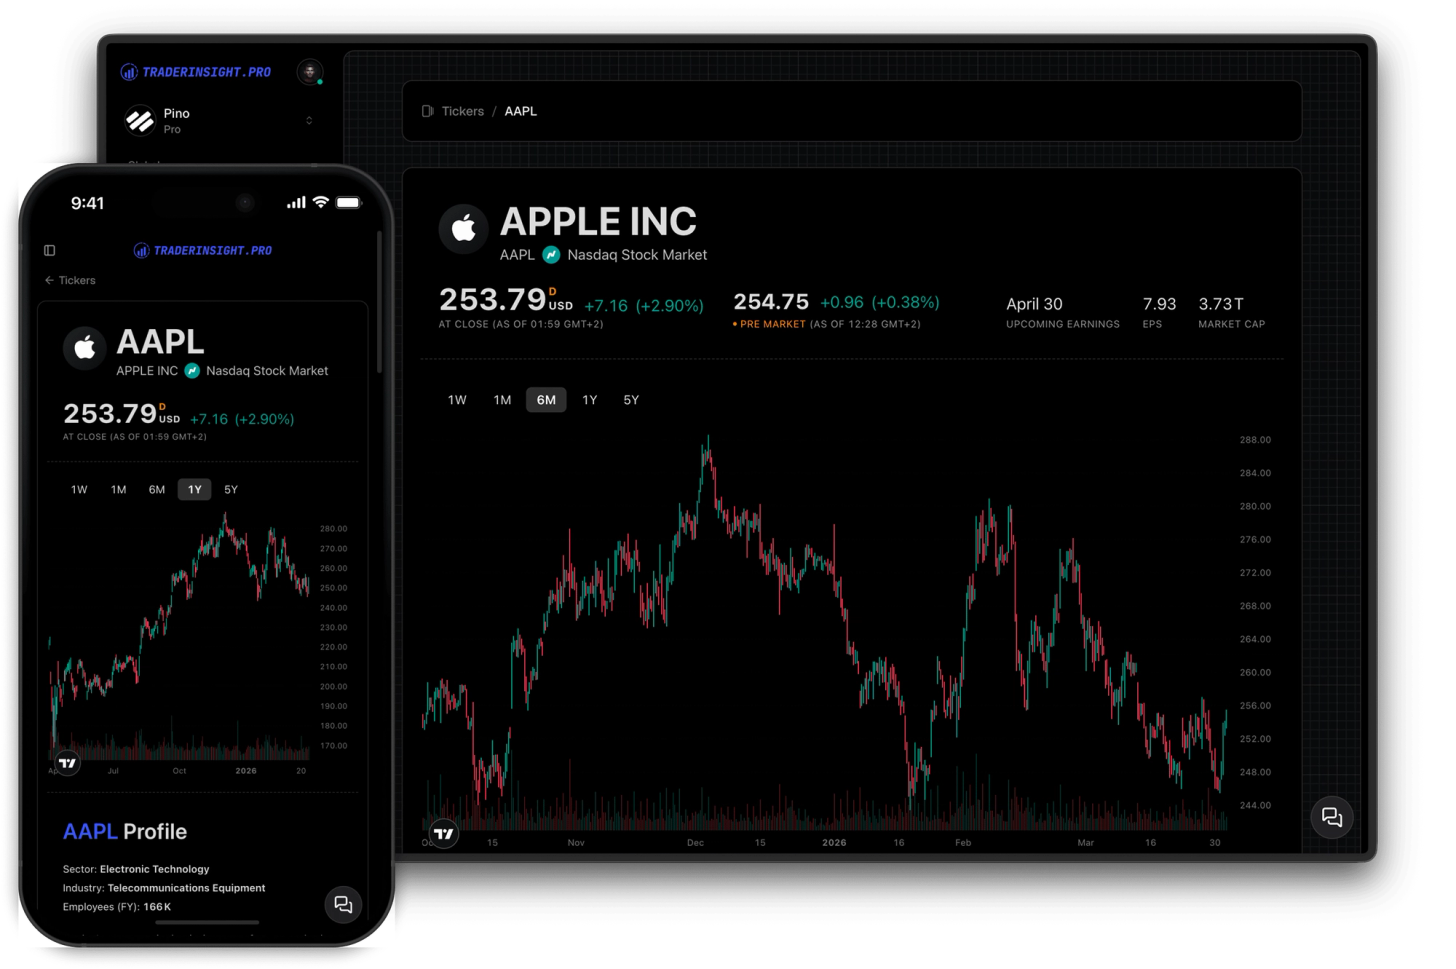
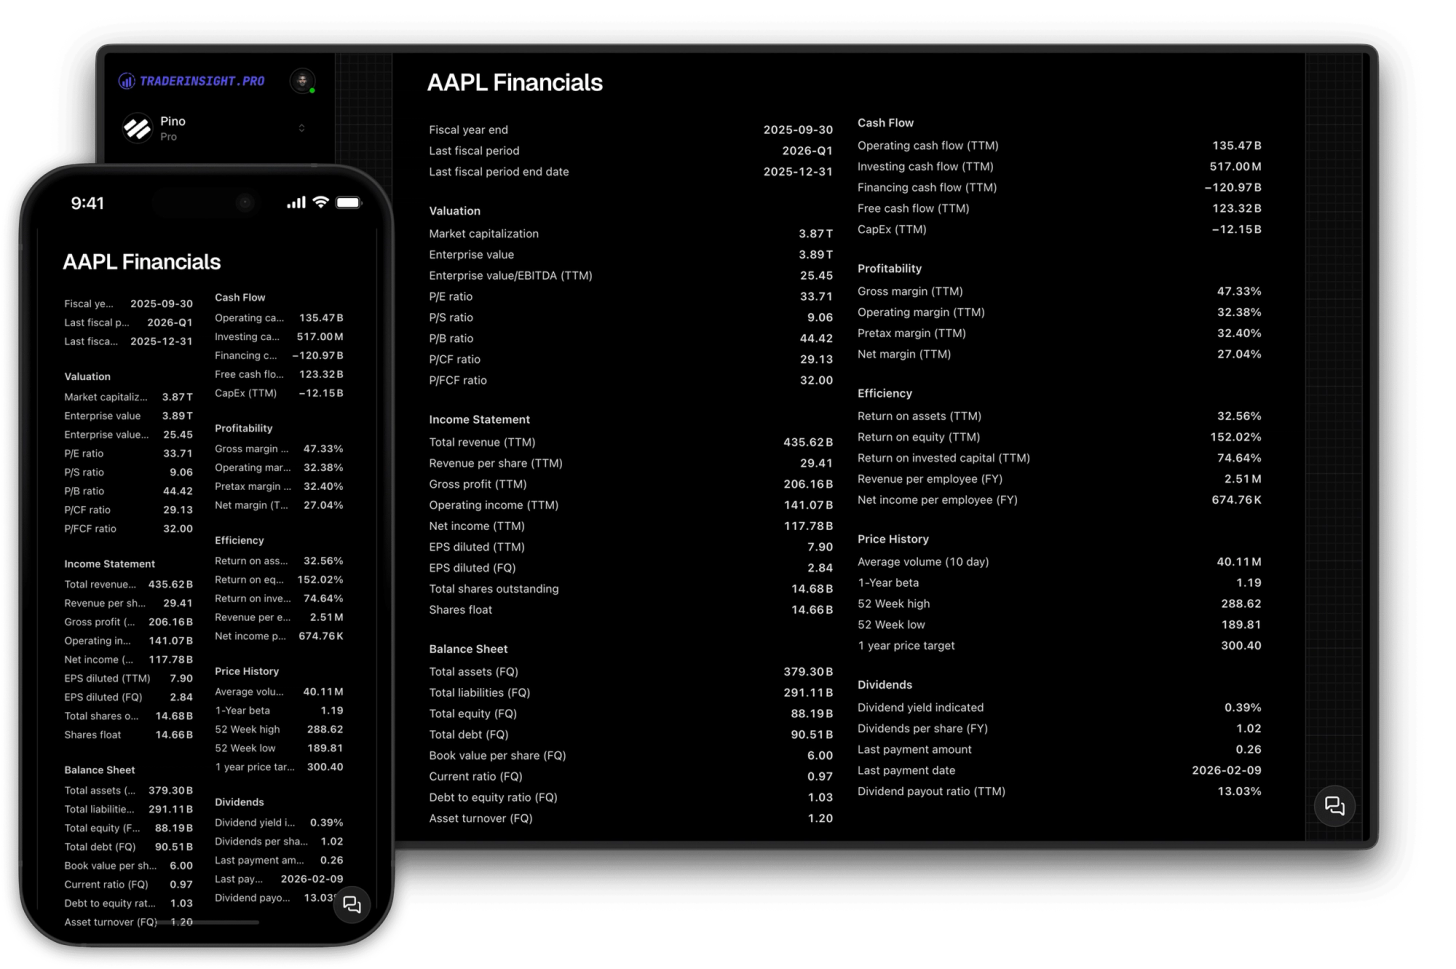
A ticker report gives you everything relevant to a symbol in a single view - live price chart, company fundamentals, analyst buy/sell/hold ratings from top institutions, dividend schedule, and the latest news headlines. Not spread across three tabs. Not copy-pasted into a separate research tool. Right inside your journal, one click from any trade.
Every symbol across your stocks, options, dividends, futures, and more is a live link in TraderInsight.pro. Click it from a trade row, from the tickers table, or from inside a dividend modal and you land instantly on that ticker's report page. The live TradingView chart is embedded with real-time price and bid/ask spread. Company fundamentals - P/E ratio, EPS, market cap, sector, revenue, and more - load alongside it. Analyst ratings from leading institutions show the current buy, hold, and sell consensus. Upcoming and historical dividend dates appear next to your own dividend records.
What makes this genuinely useful for review sessions is the combination: your own P&L, win rate, and trade count for that ticker, pulled directly from your journal and displayed right next to the live market data. You are not just looking at a chart - you are looking at a chart you have actually traded, with the real-world context that surrounded those trades. From there, go deeper with AI analysis, performance reports, or comparison reports without leaving your journal.
Every ticker report includes a full TradingView chart with real-time price, bid/ask spread, and complete price history across all timeframes. Company fundamentals: P/E ratio, EPS, market cap, sector, revenue, and more - for every symbol you trade across stocks, options, futures, etc. The data updates automatically. There is nothing to configure.
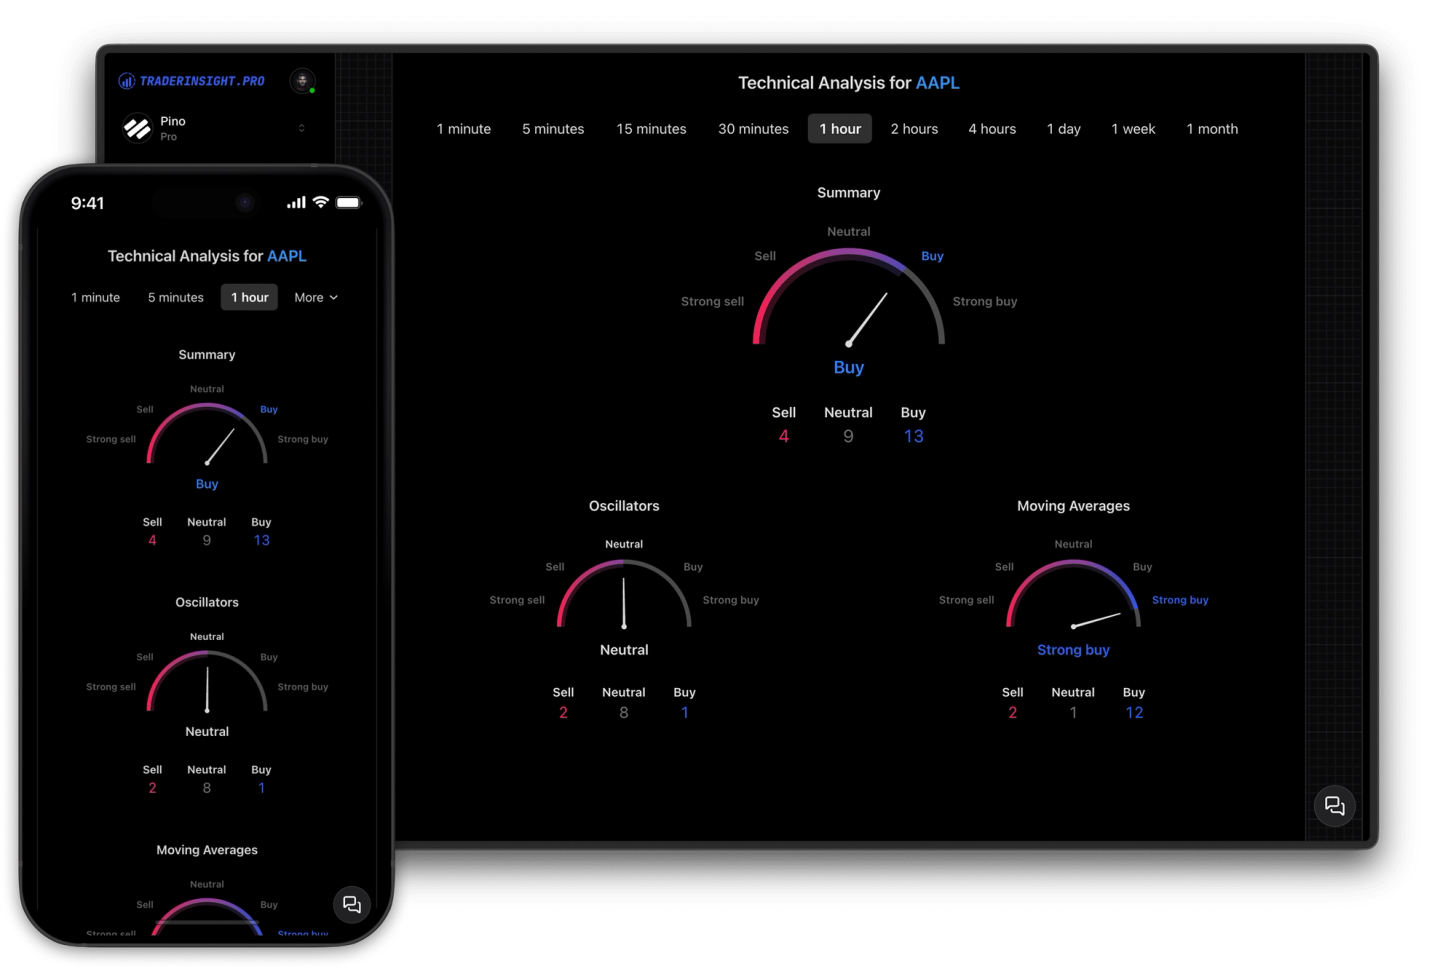
See official buy, hold, and sell ratings from leading institutions directly on the ticker page. Analyst consensus data is directly integrated into your journal so you can instantly cross-reference whether your trades on a symbol are aligned or at odds with where institutional analysts stand.
The combination that makes ticker reports genuinely useful for review: your total P&L, win rate, and trade count for each symbol pulled directly from your journal and displayed alongside the live chart, fundamentals, and analyst ratings. You are not just looking at a chart - you are looking at a chart you have actually traded, with real context around those trades.
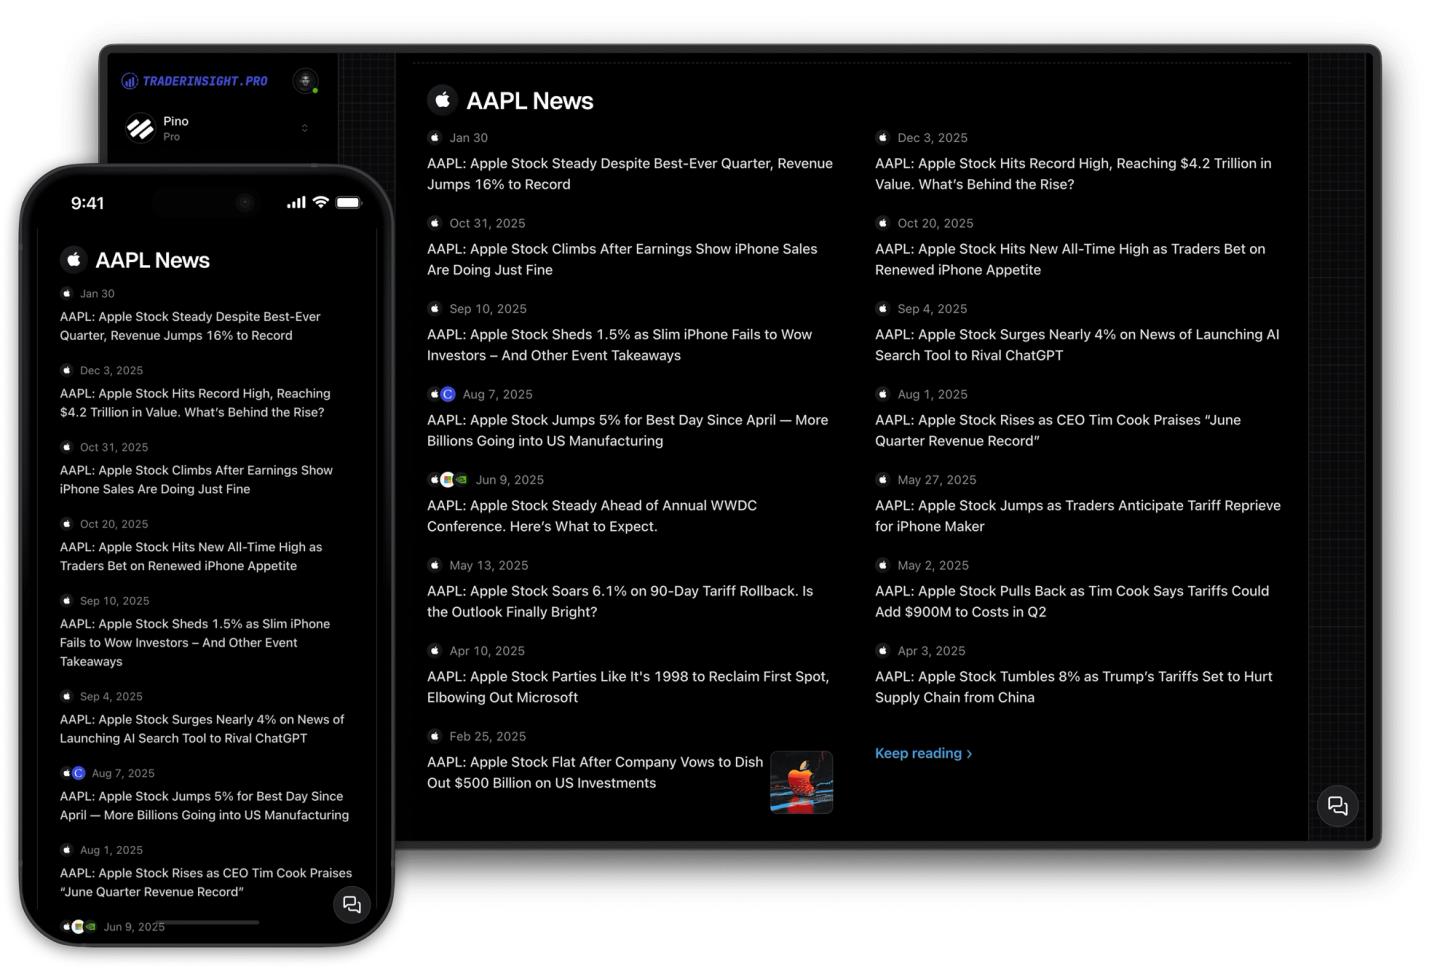
Upcoming and historical dividend payout dates are shown alongside your own dividend records, so you can see whether your dividend trades are performing as expected. Top news stories for the symbol surface the context you might have missed.
Discover answers to frequently asked questions right here. If you can't find what you're looking for then reach out.
A ticker report is a dedicated page for a specific symbol that combines live market data with your personal trading history for that instrument. On TraderInsight.pro, every ticker report includes a live TradingView price chart, company fundamentals, analyst ratings, dividend schedule, top news, and your own P&L, win rate, and trade count for that symbol.
Each ticker page shows P/E ratio, EPS, market cap, sector, revenue, and additional company fundamentals for the instruments you trade. The data is updated automatically - there is nothing to configure.
Official buy, hold, and sell ratings from leading institutions are displayed on every ticker page and updated in real time. You can see the current analyst consensus alongside your own P&L and win rate for that symbol.
Click any symbol - from the tickers table in the sidebar, from a trade row, or from inside a dividend modal. The ticker report opens instantly. You can also access ticker tables directly from the sidebar under each asset group.
Yes. Upcoming and historical dividend payout dates appear on the ticker page alongside your own dividend trade history if available. This makes it easy to see whether your dividend capture trades are performing as expected.
Yes. Your total P&L, win rate, and trade count for each symbol are pulled directly from your journal and displayed on the ticker page alongside the live market data.
Yes. A full TradingView chart is embedded on every ticker page with real-time price, bid/ask spread, and complete historical price data across all timeframes.
Yes. Ticker pages are designed to be used alongside AI analysis. After reviewing the live market data on a ticker page, you can use AI analysis to ask plain-language questions about your performance on that symbol - your full journal context is always available.
Yes. Ticker reports are available on all TraderInsight.pro plans.
Yes, fully. Ticker reports are completely functional on every device - the same live charts, analyst ratings, fundamentals, and your personal stats, with no features removed on mobile.
A stock screener shows you market data on symbols you search for. Ticker reports on TraderInsight.pro are built around the specific symbols you have actually traded - combining live market data with your own P&L history, win rate, and trade count for each one. The focus is on understanding your past performance in context, not screening for new opportunities.
Use ticker reports after each session to review the exact symbols you day traded with full context in one place: live chart structure, intraday news, analyst sentiment, and your own win rate and P&L on that ticker. This helps you quickly spot repeat mistakes like chasing late entries, overtrading low-quality setups, or trading through avoidable news catalysts.
For swing trading, use ticker reports to validate multi-day ideas before and after entries. Check company fundamentals, analyst consensus shifts, dividend schedule, and recent news, then compare those factors against your historical performance on the same symbol. It is a fast way to decide whether a ticker deserves another swing setup or should be avoided.
Options traders can use ticker reports to analyze the underlying symbol before taking a contract. Review the live chart, catalyst news, analyst ratings, and your own tracked results on that ticker to see whether your directional read has edge. This context is especially useful for avoiding options trades on symbols where your historical win rate is consistently weak.
For futures trading, ticker reports give you a single page to review price action context and your own execution history for the symbol. Use your per-ticker P&L, win rate, and trade count alongside live chart and news context to identify where your futures performance is strongest, and where you should tighten risk rules or reduce size.
For forex trading, use ticker reports to connect your currency-symbol trade history with live chart action and current market context on one page. Review your per-ticker win rate, trade count, and P&L next to price movement and news so you can identify which pairs and setups are consistently working, and which ones need tighter rules.
Crypto traders can use ticker reports to evaluate each coin or symbol with both live market context and personal results in one workflow. Compare your historical P&L and win rate on that crypto ticker against current chart structure, sentiment signals, and news flow to decide whether to keep trading it aggressively, reduce size, or pause it entirely.
Journaling starts with data. You can import from countless brokers through simple auto-sync and drag-and-drop. And if your broker is not yet supported, we can add it in a few clicks.
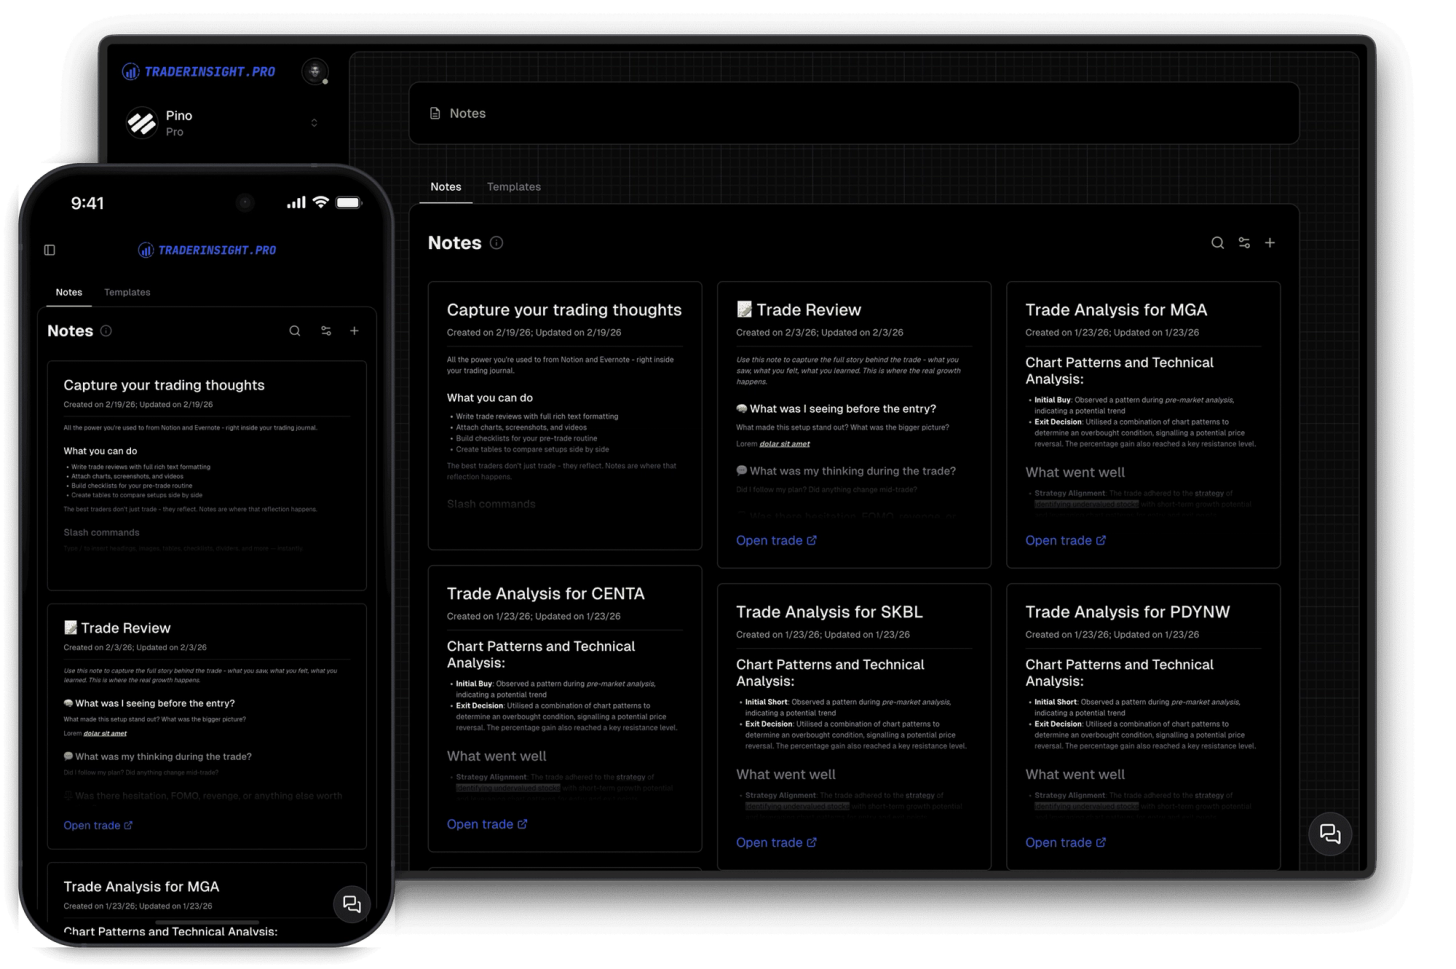
Enhance your trading insights by adding notes to trades. Enjoy rich-text formatting capabilities straight out of the box.
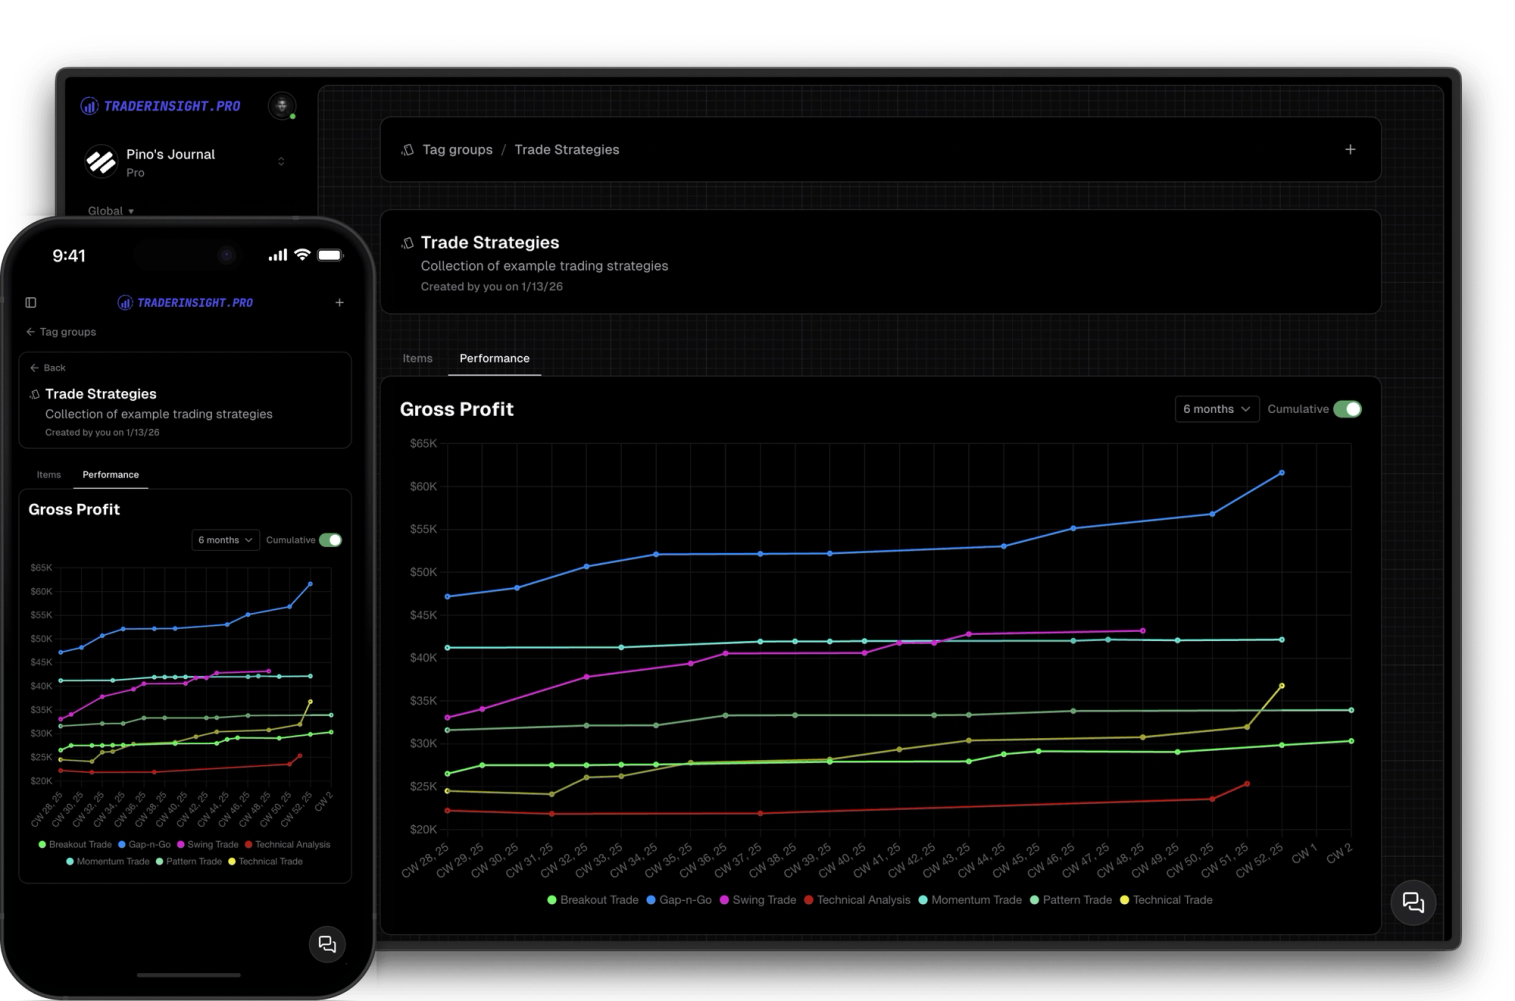
Create and use custom tag groups to simplify tracking and analyzing your strategies and trade details.