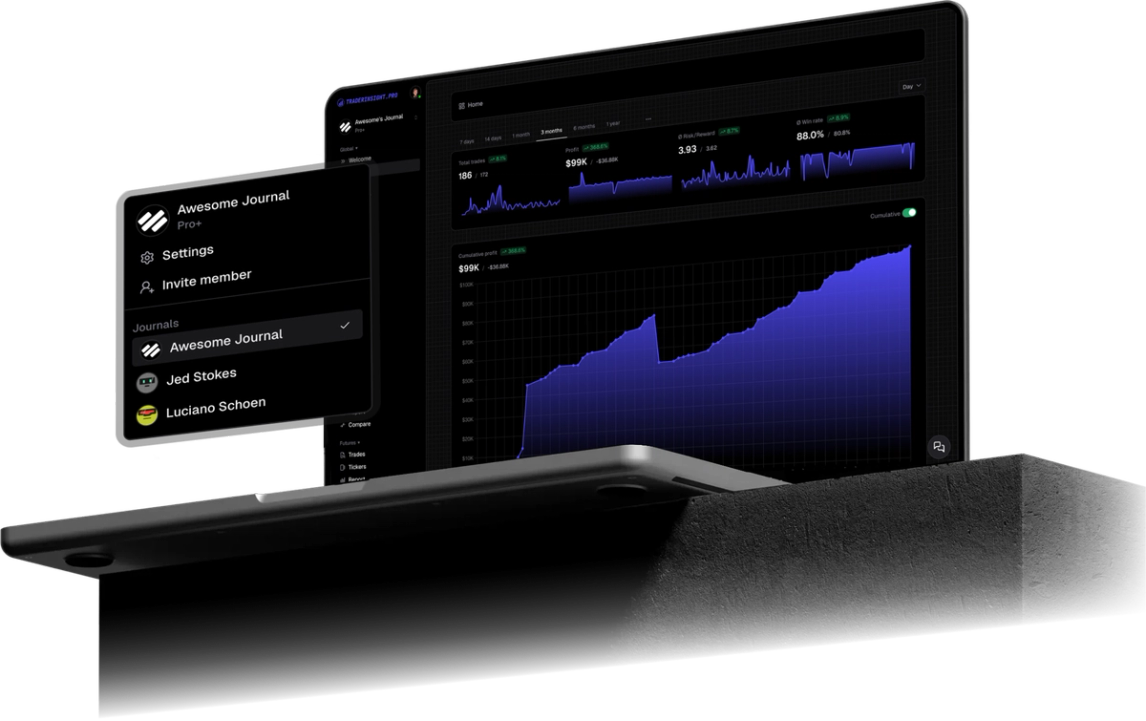
Share your trades
Share trades and collaborate with anyone
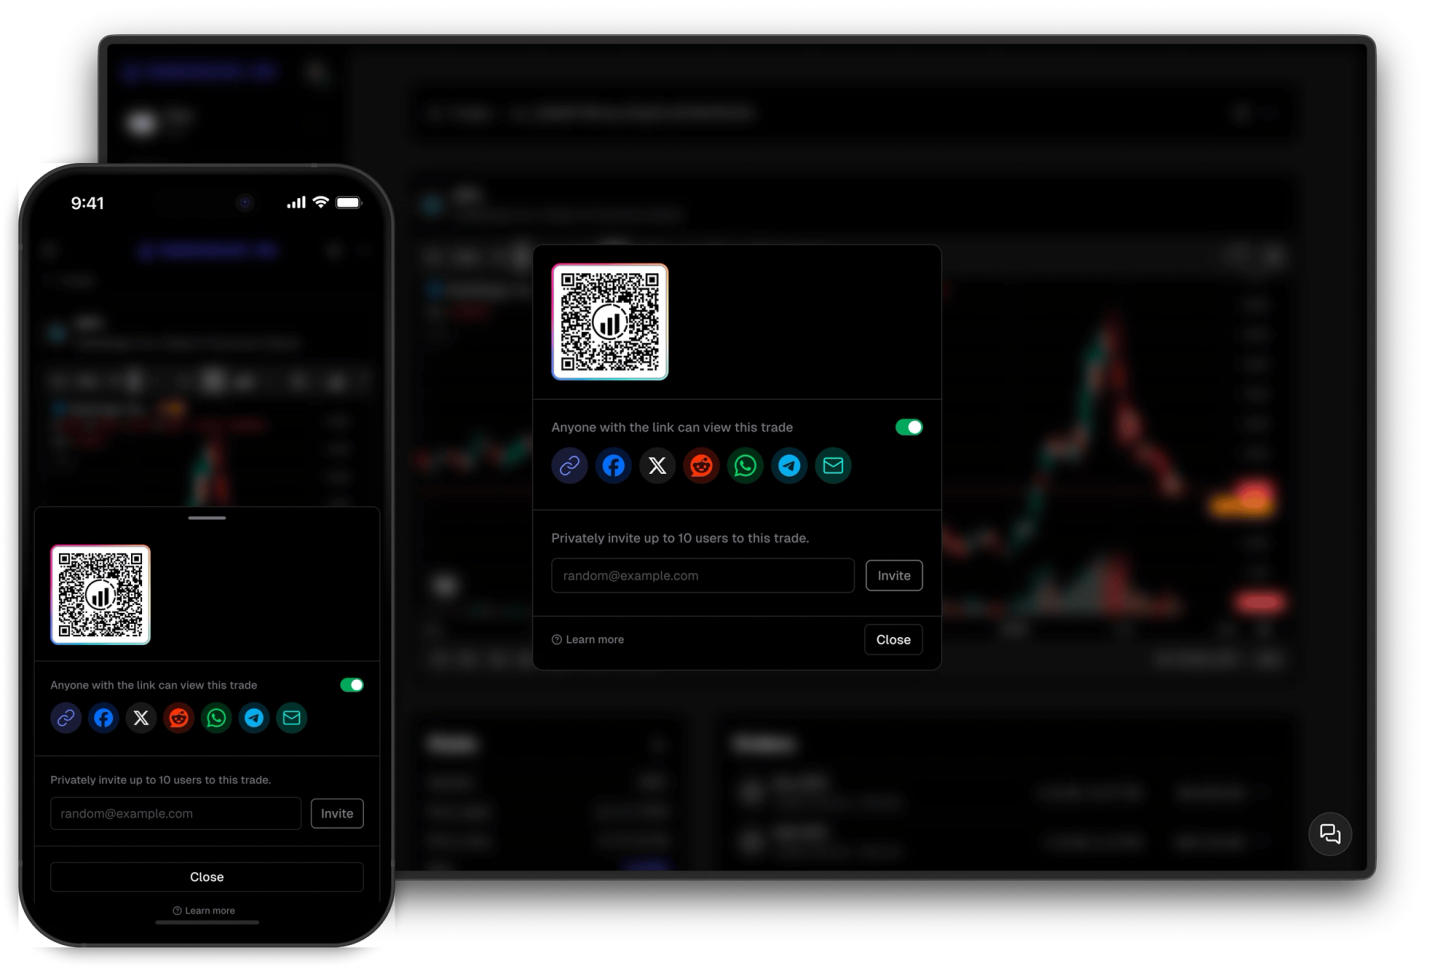
Share your trades privately with selected individuals or showcase them to the world with ease.
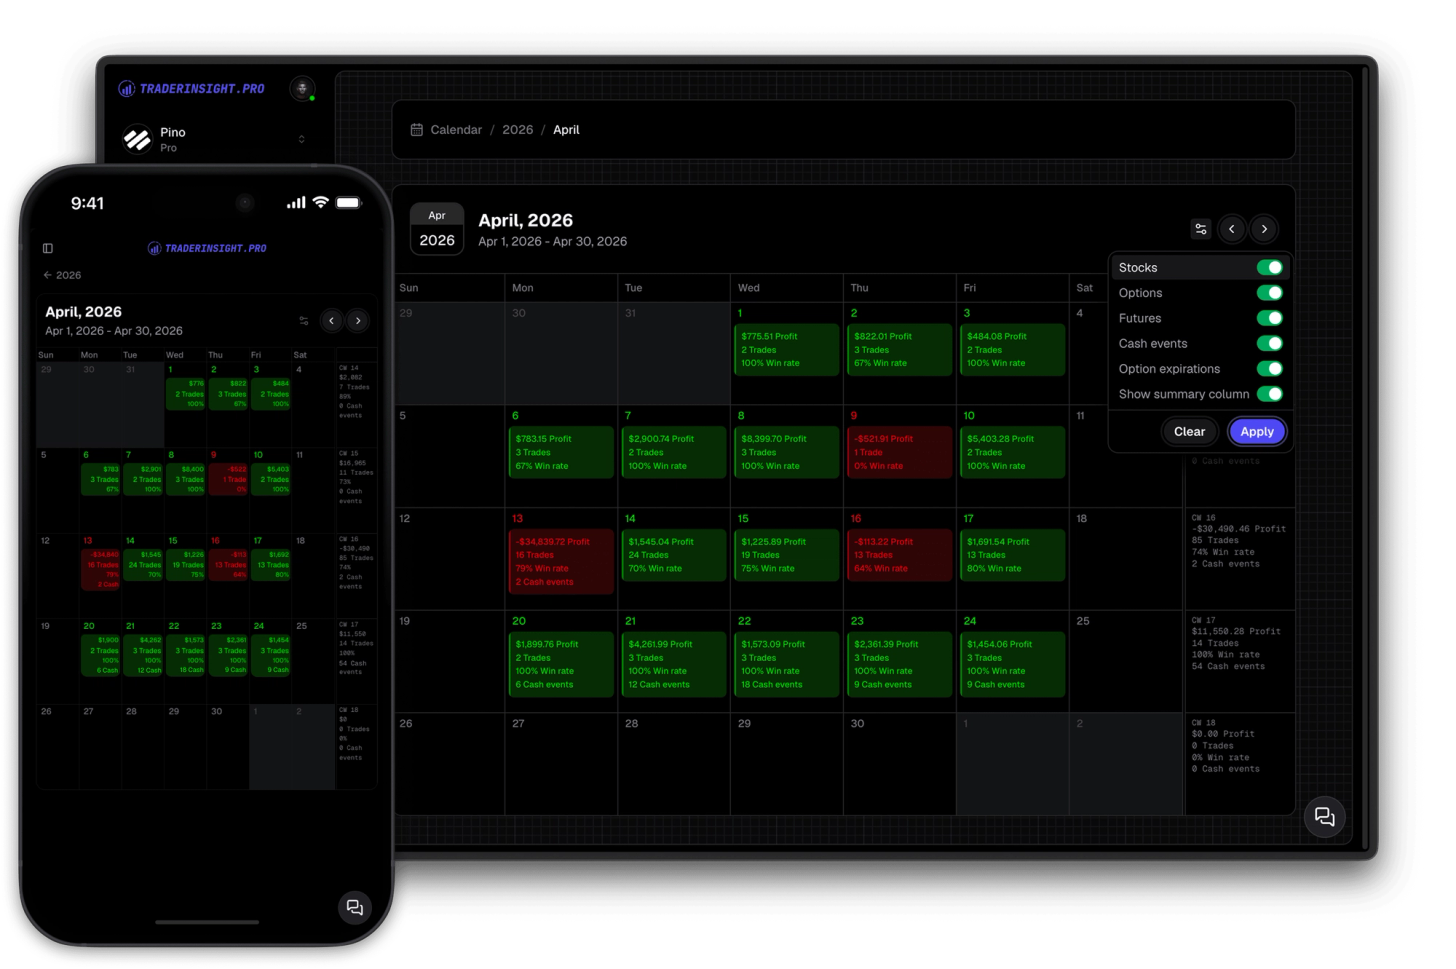
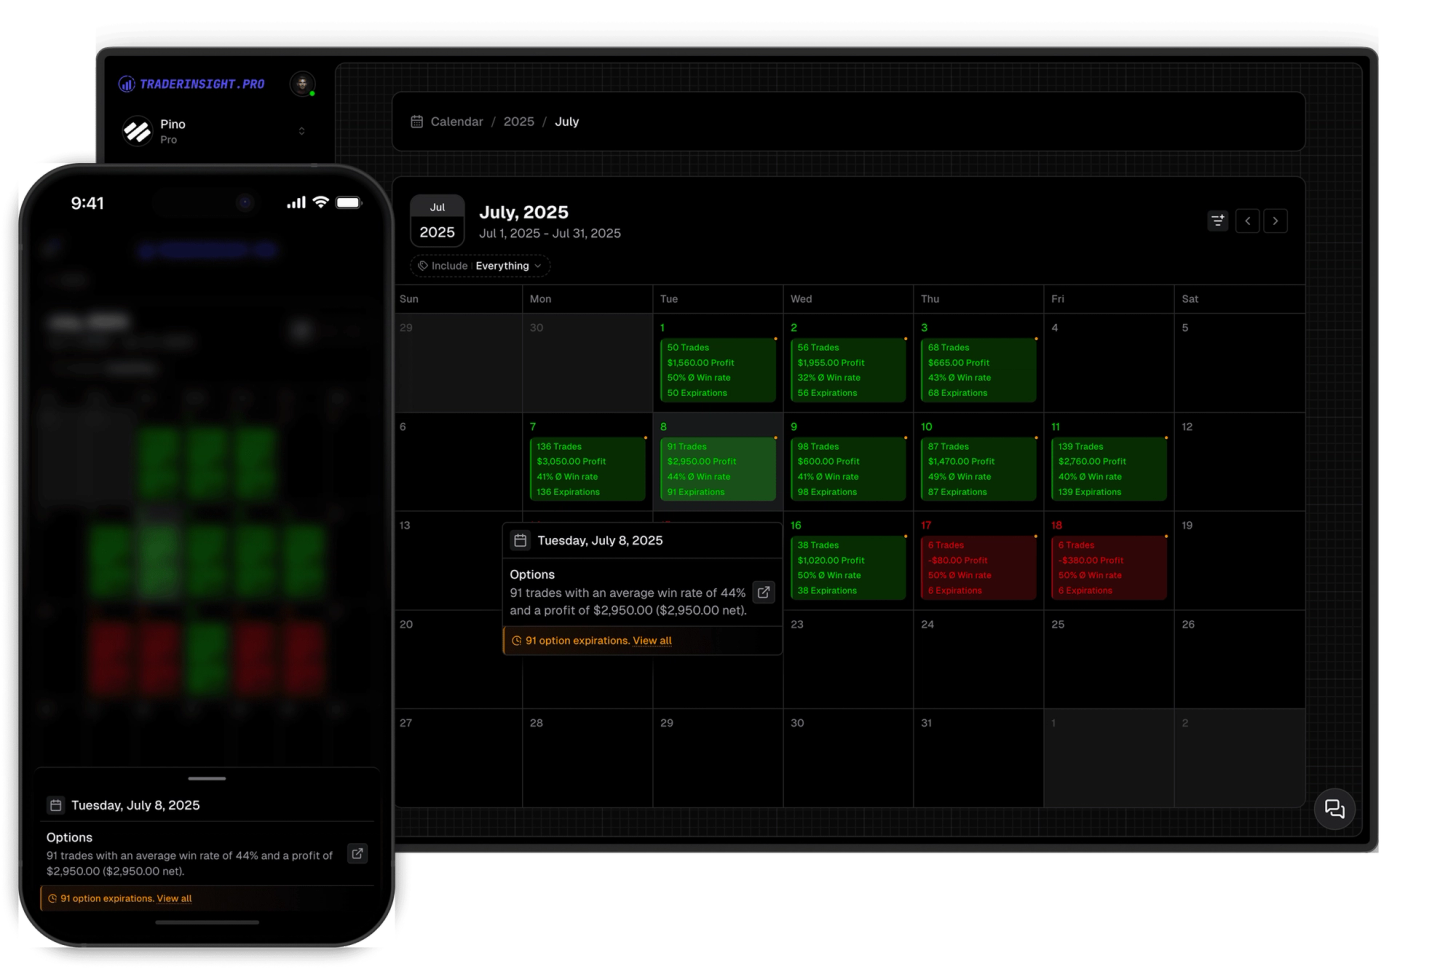
A P&L calendar turns your trade history into a visual record of performance - every session color-coded green or red, scaled to the size of your actual wins and losses. Not a table of numbers you have to read line by line. A trade calendar you can scan in seconds to see where your month is heading, where your drawdowns cluster, and whether the patterns you suspect are actually there.
TraderInsight.pro gives you three calendars: a compact one on your main dashboard for a daily pulse check, and a full yearly and monthly view for the bigger picture. All three use the same dynamic color system - multiple shades of green scaling up with profitable sessions, deepening levels of red scaling with your losses, all calibrated automatically to your own P&L range. Your red days and green days always reflect your reality, not a fixed scale.
The calendar also surfaces key market events alongside your own performance. Option expiration dates and dividend dates appear directly on the calendar so you can see how your trading performance maps to the events that move your positions. Click any day and get the full breakdown: win rate, total profit, trade count, and every individual trade organized by asset type - stocks, options, futures, forex, crypto, dividends, and more.
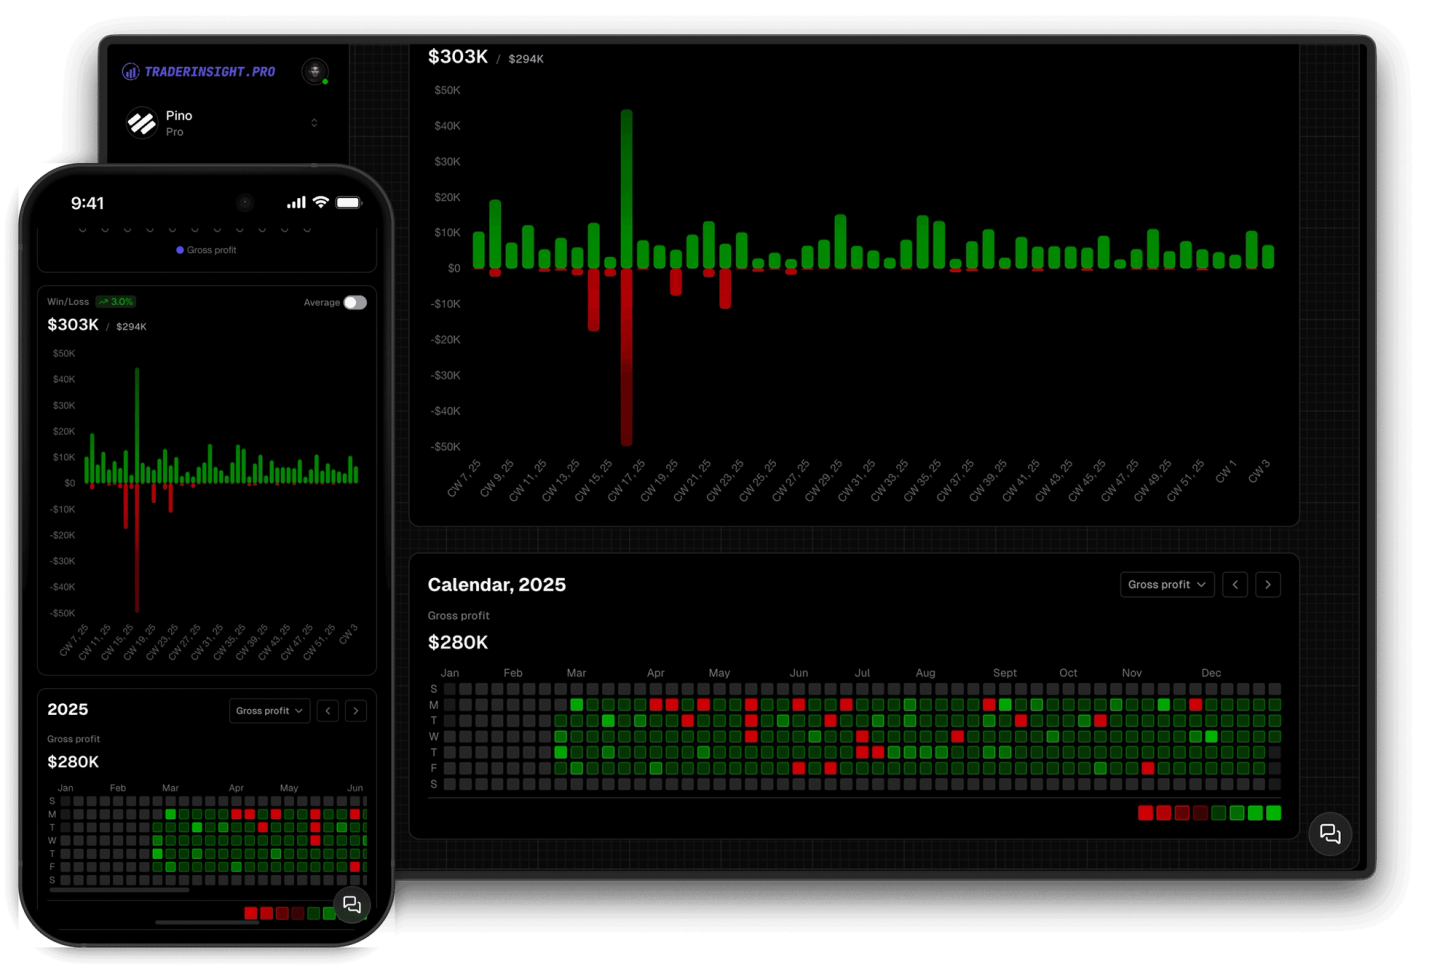
The yearly calendar gives you a full year of performance in one view. Green days, red days, winning streaks, losing runs - it's all visible at a glance without opening a single report. The kind of pattern that takes hours to find in a spreadsheet takes seconds here.
Click any date and see win rate, total profit, trade count, and every individual trade from that session - organized by asset type and linked directly to the full trade detail. One click from the calendar to the trade, no digging required.
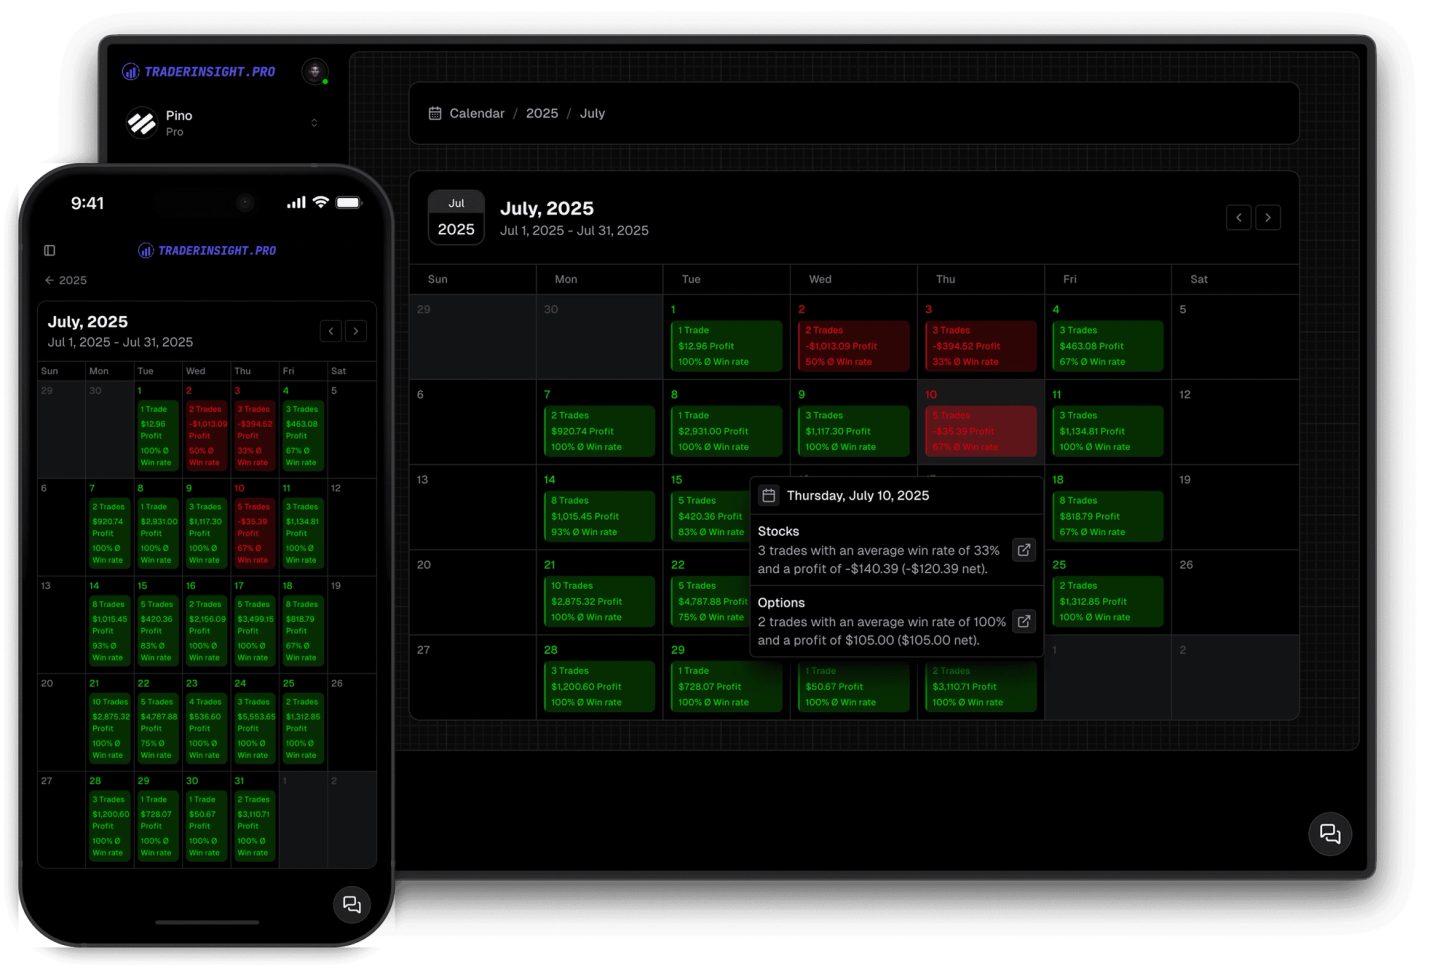
Option expiration dates and dividend dates appear directly on your trade calendar. Instantly see if your red days cluster around expiration Fridays, whether dividend trades are performing as expected, and how your P&L reacts in key market sessions. Click any date for full trade details from that session.
The compact trading calendar on your main dashboard keeps your recent performance visible at all times. Same dynamic red and green color system, same drill-down on click - always present without navigating anywhere.
Discover answers to frequently asked questions right here. If you can't find what you're looking for then reach out.
A trading calendar is a visual display of your trading performance by date - each day color-coded by profit and loss so you can see your green days, red days, winning streaks, and drawdown periods at a glance. TraderInsight.pro's trading calendar also shows option expiration dates and dividend dates alongside your P&L.
A P&L calendar maps your profit and loss to a calendar grid, with each day colored by the size of your gain or loss. TraderInsight.pro uses a dynamic color system where intensity scales to your own P&L range, so the colors always reflect your actual performance rather than a fixed threshold.
Green days are profitable sessions, red days are losing sessions. Both use multiple intensity levels that scale automatically to your own P&L range - the larger the win or loss relative to your history, the more vivid the color. This means a dark red day always signals a significant loss for you specifically, not just any losing session.
Yes. Option expiration dates appear directly on the trade calendar alongside your daily P&L, so you can see how your performance on expiration days compares to regular sessions.
Yes. Dividend dates are surfaced on the calendar so traders running dividend capture strategies or holding dividend-paying stocks can see these events in context with their actual trading results.
Green days are profitable sessions, red days are losing sessions. Both use multiple intensity levels that scale automatically to your own P&L range - the stronger the win or loss relative to your history, the more vivid the color.
Three. A compact P&L calendar on your main dashboard for a quick daily overview, and a full yearly and monthly trade calendar for the big picture. All three use the same color system and drill-down functionality.
Win rate, total profit, trade count, and every individual trade from that session organized by asset type - with direct links to the full trade detail for each one.
Yes. Go to Journal Settings and choose net or gross profit. The calendar updates instantly to reflect your preferred metric.
Yes. All trades across stocks, options, futures, crypto, forex, dividends, and more appear on the calendar.
Yes. The yearly calendar lets you flip through years to compare your red days, green days, and overall P&L patterns across different periods at a glance.
Yes, fully. The P&L calendar is completely functional on every device - same features, same drill-down, same real-time sync.
Share your trades privately with selected individuals or showcase them to the world with ease.
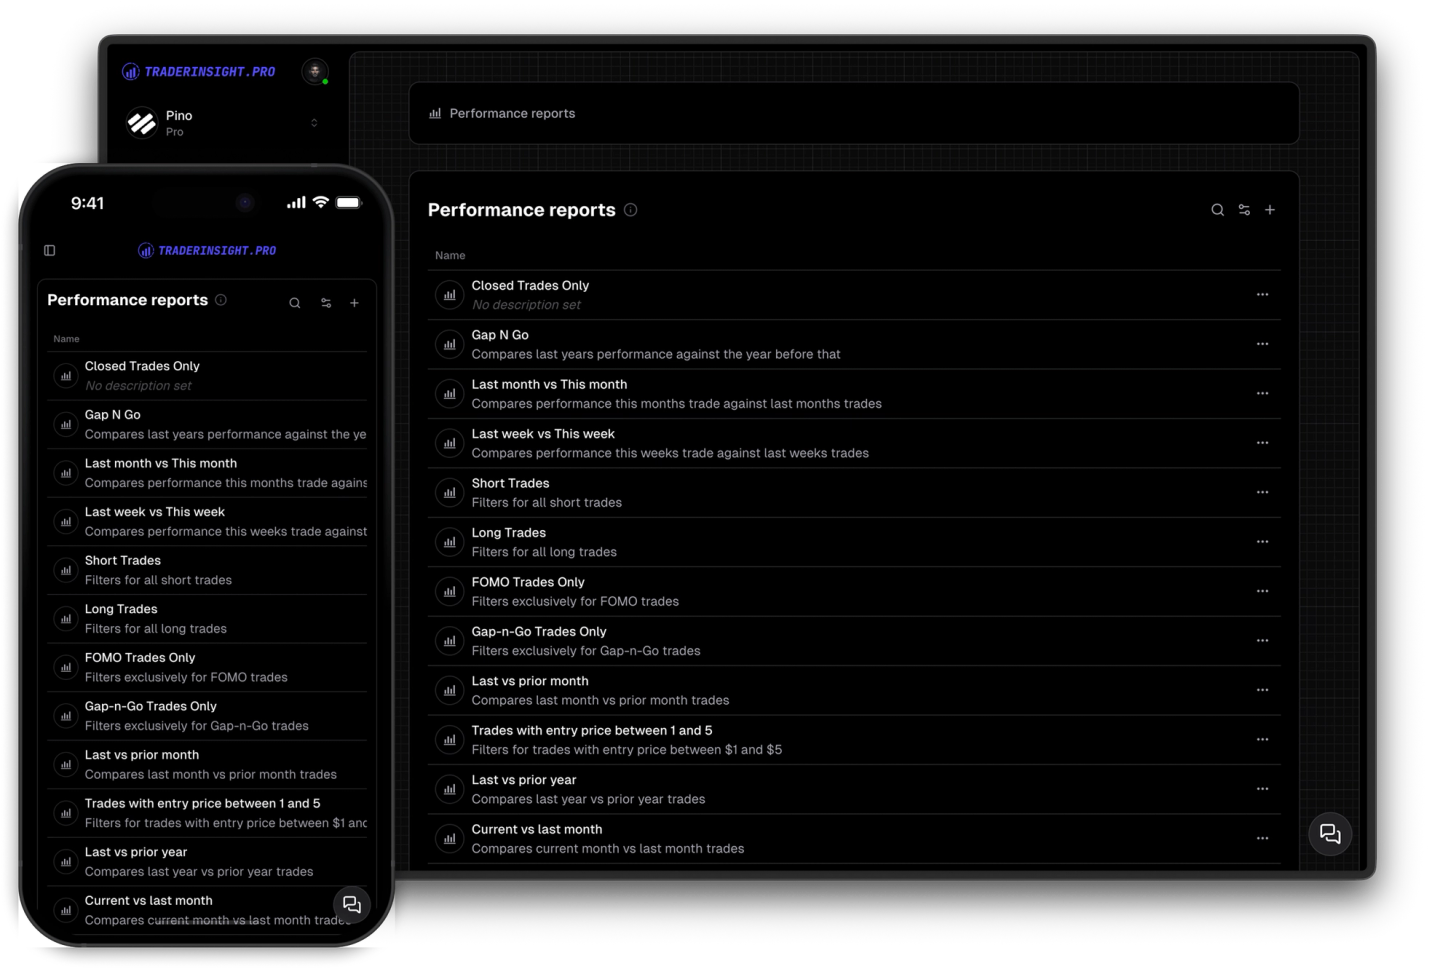
Uncover valuable insights into your trading behavior, strategies, and common pitfalls. Gain valuable insights and enhance your trading.
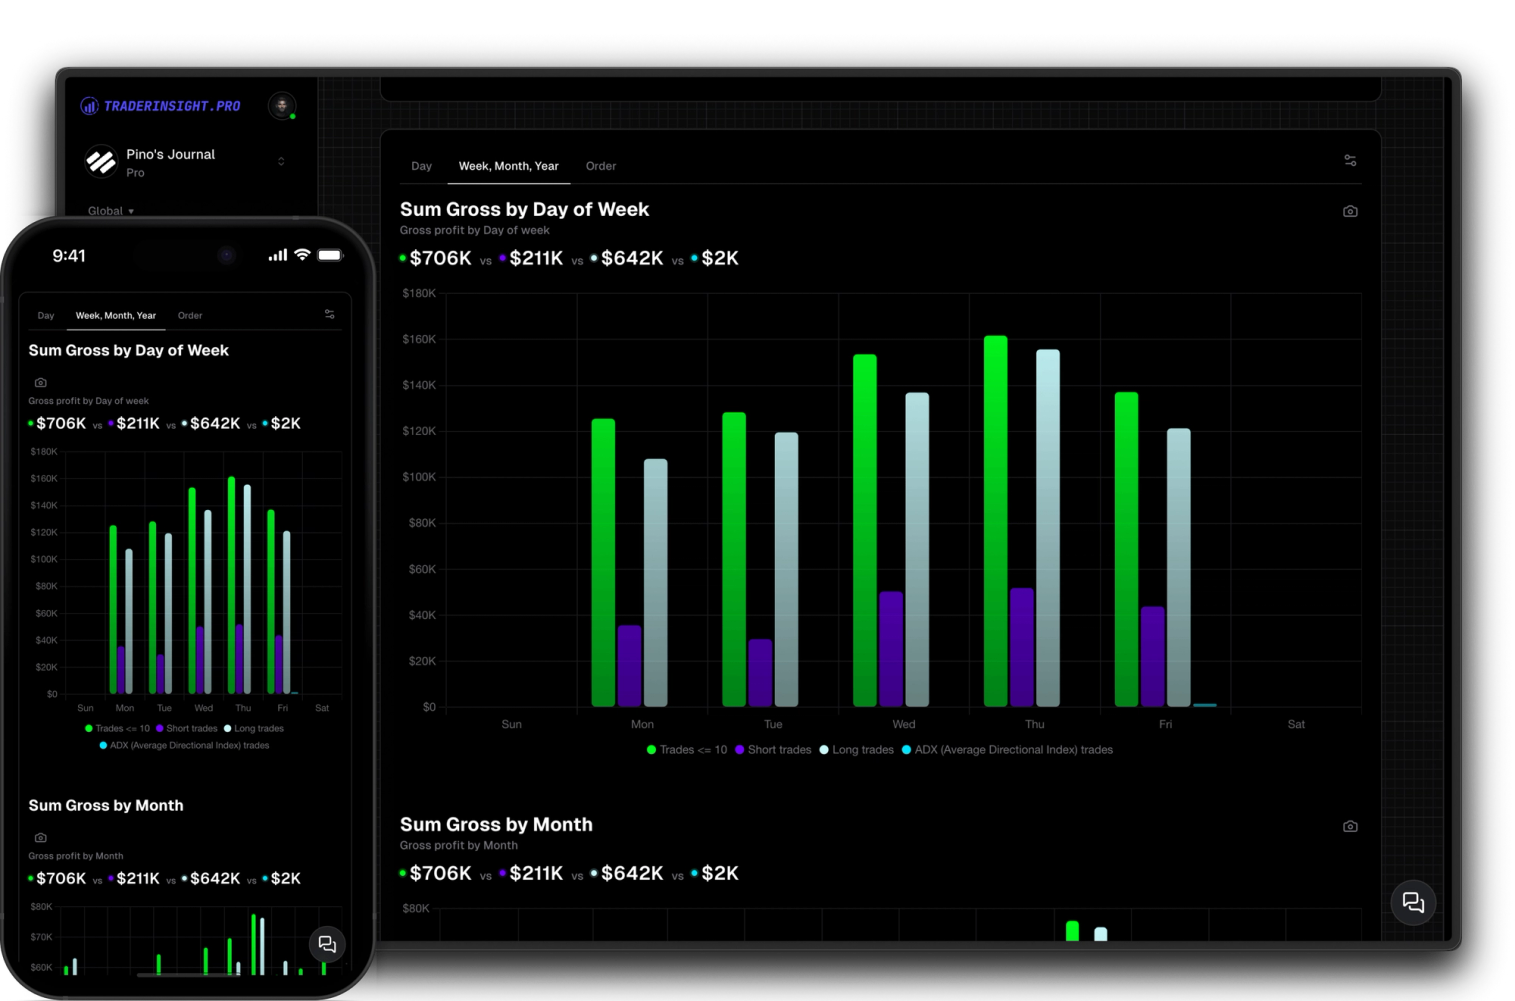
Harness the power of comparisons to optimize your trading. Easily compare your custom filters, not just strategies, to identify what works best for you.