How Trade Journaling Works
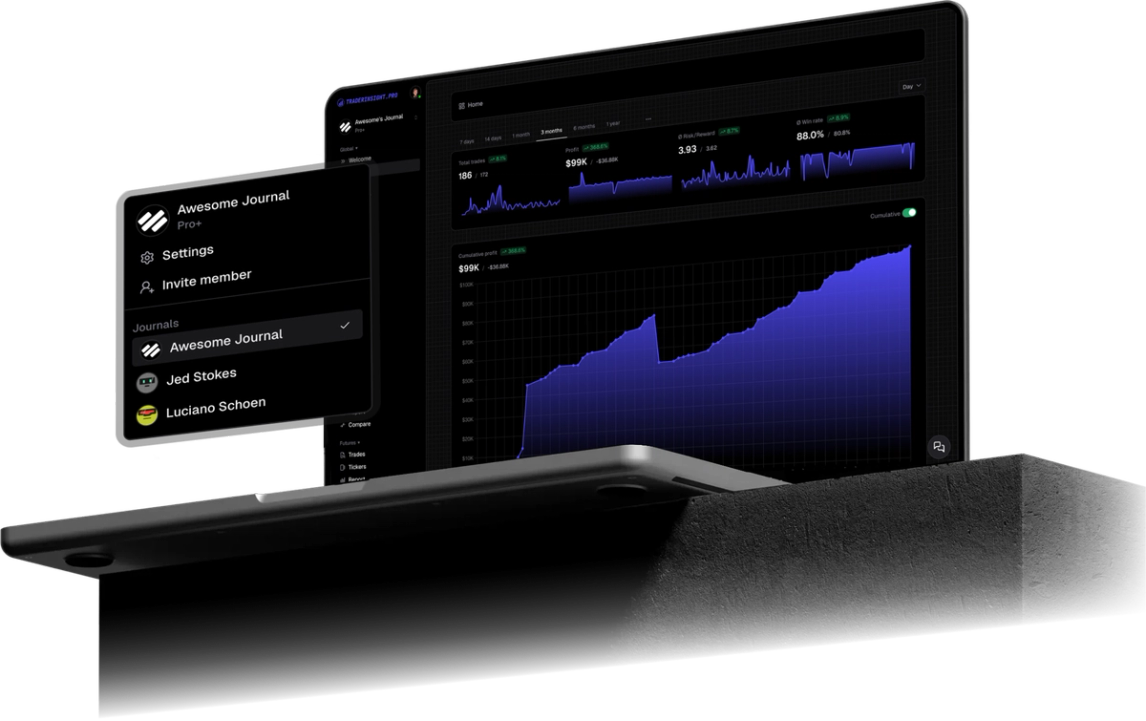
Trading is about quality, not quantity. TraderInsight.pro is the easiest way to get performance insights, track your strategies and make sure you're making the right trades.
Trading isn’t about how many buttons you press. It’s about the decisions you make when it matters - the discipline, the patience, the willingness to follow your plan even when it’s hard. Quality always beats quantity.
Your edge comes from knowing yourself as much as knowing the market. TraderInsight.pro helps you track every trade, every strategy, every mistake - so you can see the patterns that actually shape your performance.
This is where biases become visible, insights become actionable, and growth becomes measurable. Build reports, compare strategies, and understand what’s really driving your results.
And when you're ready, share your journey - privately with a mentor or publicly with your community. Trading is a craft. Here, you have the tools to master it.
Import all trades in seconds
Connect your broker or import through drag-n-drop to import every trade, fee, dividend and cash transaction.
- 100+ brokers supported out of the box
- Use realtime sync and API imports
- Multi-accounts & multi-currency
- New brokers added the same day
Label every trade by what actually matters.
Strategies. Setups. Mistakes. Market conditions. Moods. Build your own tag groups with unlimited depth and tag once, report forever.
- Tag groups like "Strategies" → Momentum, Breakout, Pullback, etc.
- Filter trades by any tag and tag group
- Compare performance across any tag dimension
Custom reports built for traders, not accountants.
Win rate, risk/reward, hold duration, time-of-day, strategy breakdowns. Every KPI, every chart, every filter - tailored to how you actually trade.
- Pre-built dashboards for you
- Create fully custom reports
- Compare any 2+ strategies, tags, or time windows side-by-side
- 100% customizable: add your own KPIs, charts, filters, and more
- Filterable dividend & cash reports, per symbol or window
Generate AI reports and insights.
Skip the spreadsheets. Ask "What are my 3 most profitable setups last quarter?" or "When do I tilt?" and get instant answers as charts, tables or summaries - backed by your full trade history.
- Natural language - no SQL, no formulas
- Answers as charts, tables, or summaries
- Context-aware: follow-up questions just work
Notion-style notes, wired into your trades.
Document setups, post-mortems, tilt triggers and rules - then link them to specific trades. All your thinking and all your data, finally in the same place.
- Slash-command editor with templates
- Attach notes directly to any trade
- Create custom note templates
- Filter notes by tag, date or criteria
Journal your trades today