Table of Contents
Your trading calendar just got significantly more powerful. Two new features are now live across all plans: full cash event visibility directly in your day trading calendar, and a calendar week summary column that gives you a complete P&L snapshot for every week at a glance - without leaving the calendar view.
What is the cash events layer in the trade calendar?
The trade calendar now displays your cash events - broker fees, withdrawals, deposits, interest payments, and other non-trade transactions - alongside your standard trade data. Previously, your PnL calendar showed your stocks, options, futures, forex, and crypto activity. Now, every cash movement that affects your real account balance is visible in the same view, so your calendar reflects your complete financial picture - not just your trading activity in isolation.
This matters because broker fees and withdrawals directly affect your net performance. A day that looks profitable on trades alone can look very different once fees are factored in. With cash events on the calendar, that gap is instantly visible.
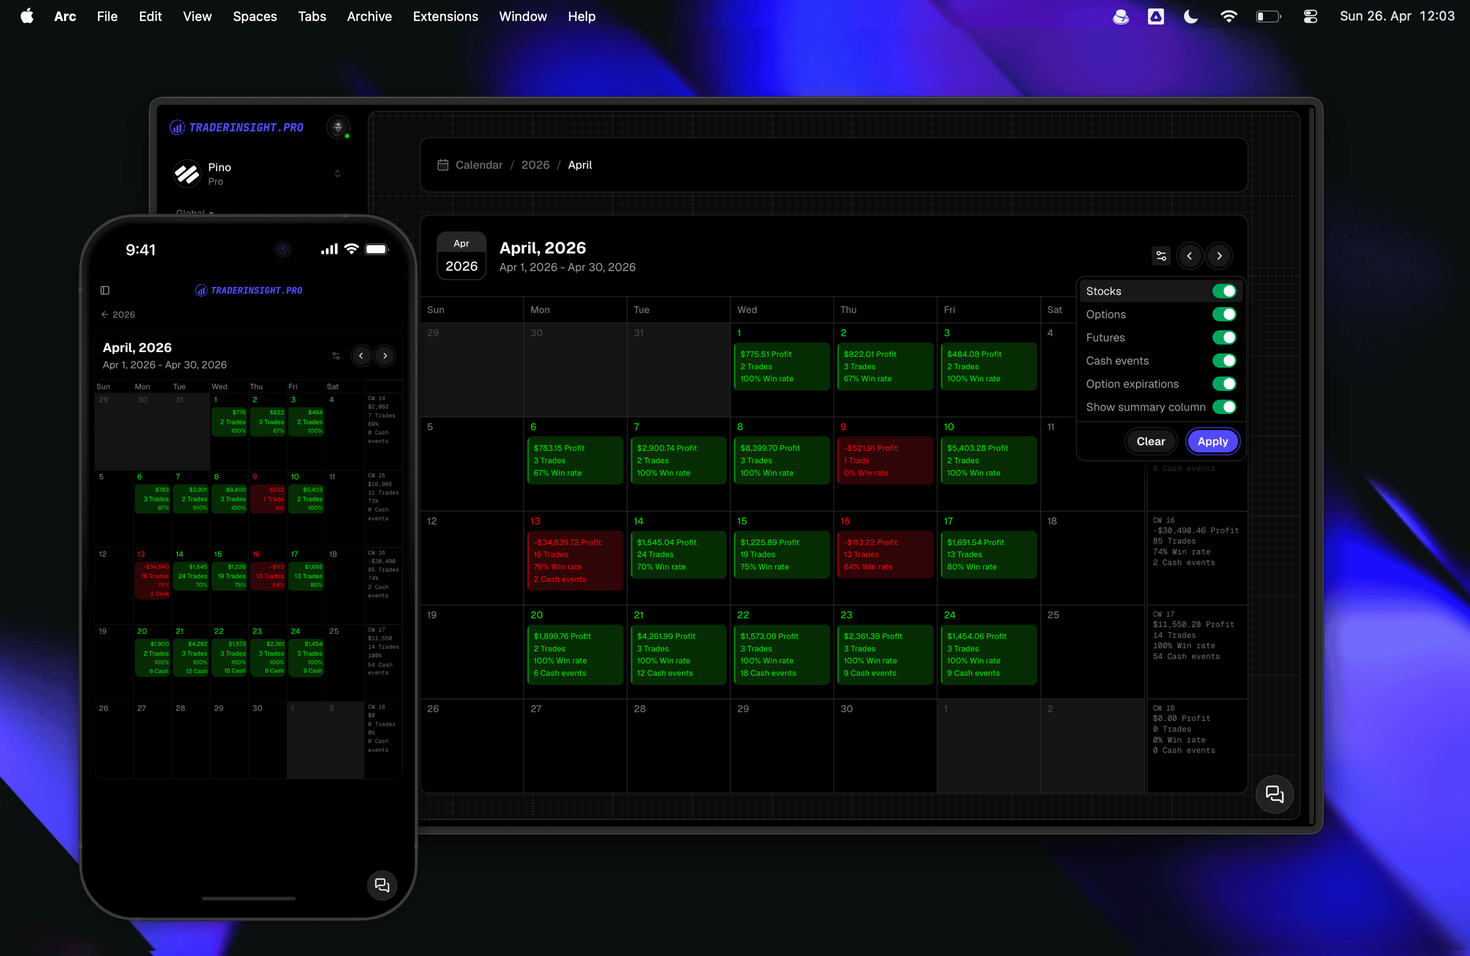
How do the category and asset toggles work?
Every category and asset class can be toggled on or off independently. You control exactly what appears on your trading calendar at any moment - showing only the data that is relevant to the analysis you are doing right now. Want to isolate your futures trades without cash noise? Toggle everything else off. Want to see the full picture including deposits and interest? Turn it all on.
This applies across all supported asset classes and cash event types, giving you a genuinely flexible day trading calendar that adapts to your workflow rather than forcing a fixed view.
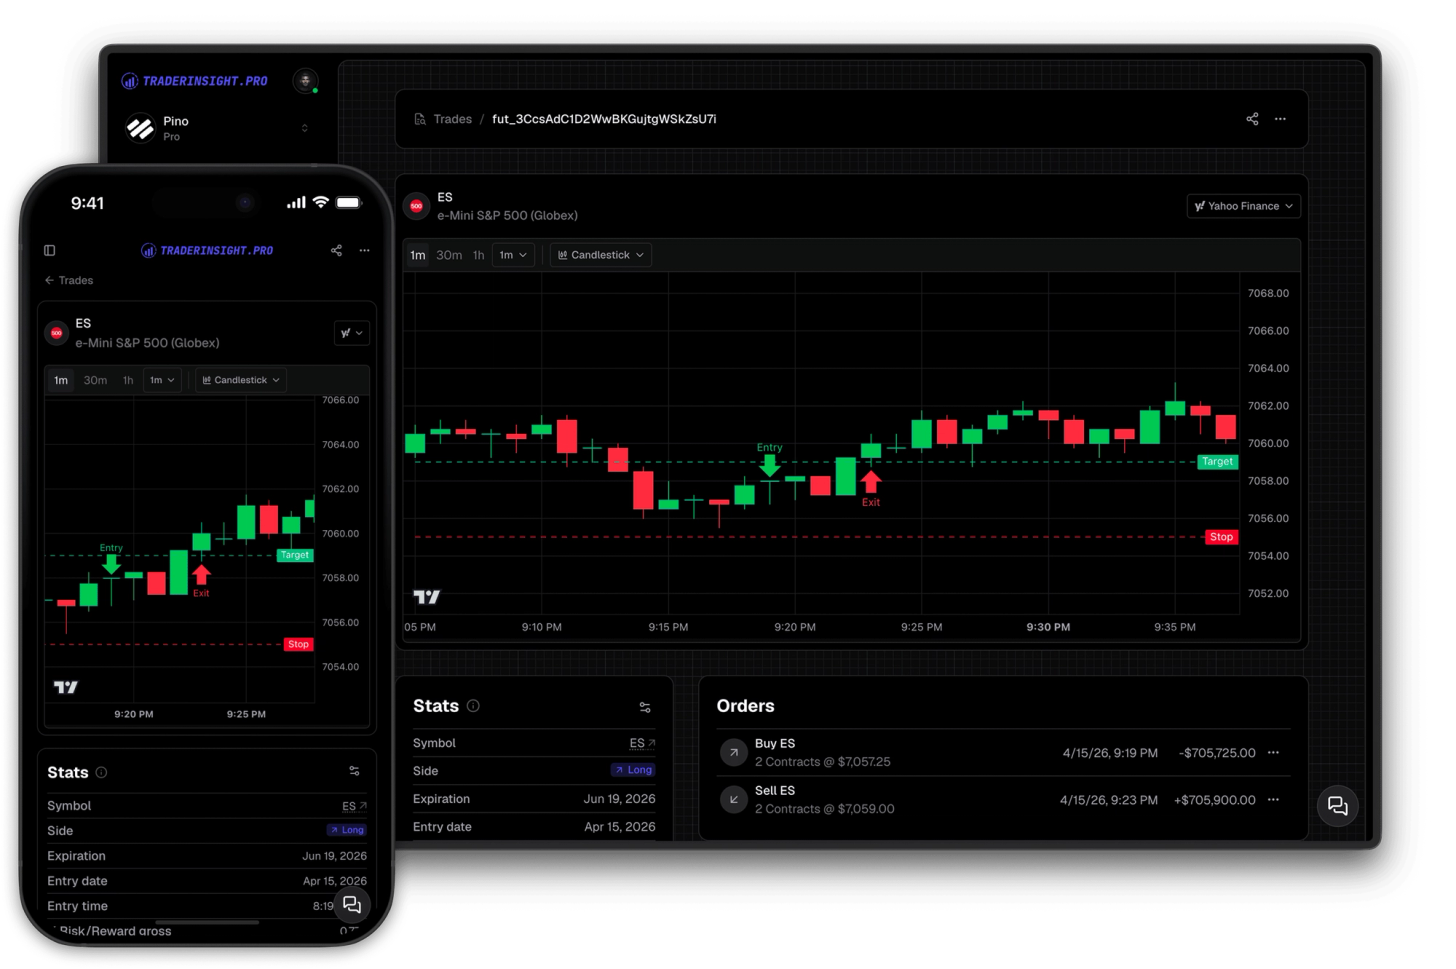
How does the day detail view work?
Clicking any day on the PnL calendar opens a detailed breakdown for that date. Each asset class and cash event type is displayed individually - all transactions, trades, and entries for that day, separated by category. This makes it fast to review exactly what happened on a specific trading day without having to cross-reference reports or filter through a full trade list.
What is the calendar week summary column?
The calendar week summary column adds a dedicated column to your trade calendar showing the week number alongside a full aggregation of your weekly activity. For each calendar week you get:
- Total trades for the week
- Average win rate across all trades
- Total cash events and transactions
- Total profit, both net and gross
This column can be toggled on or off. When it is on, your weekly P&L is immediately visible without any additional clicks or report navigation - making it the fastest way to review how every week performed at a glance. For day traders and swing traders who review their performance week by week, this removes a step that previously required opening performance reports separately.
How does the weekly summary column help with PnL review?
The aggregation in the week summary column combines trade P&L with cash events, so the totals reflect your actual account movement for the week - not just closed trade P&L. This gives a more honest weekly number, especially for accounts with significant fees, interest income, or funding activity. Combined with AI analysis and comparison reports, the calendar week column becomes a useful first filter: identify the weeks worth digging into, then go deeper.
Which plans include these calendar features?
Both features - cash event display and the calendar week summary column - are available on all plans at TraderInsight.pro. No upgrade is required.
How to get started
If you are already using TraderInsight.pro, the updated trading calendar is live now. Open your calendar, use the toggle controls to configure your view, and enable the week summary column if you want the weekly P&L aggregation visible at all times.
If you are not yet using TraderInsight.pro, start your trading journal and import your trade history to see the full calendar - including cash events, weekly summaries, and per-asset filtering - from your first session.
Have a feature you want to see next? Request it here - the roadmap is shaped by traders using the platform every day.