Table of Contents
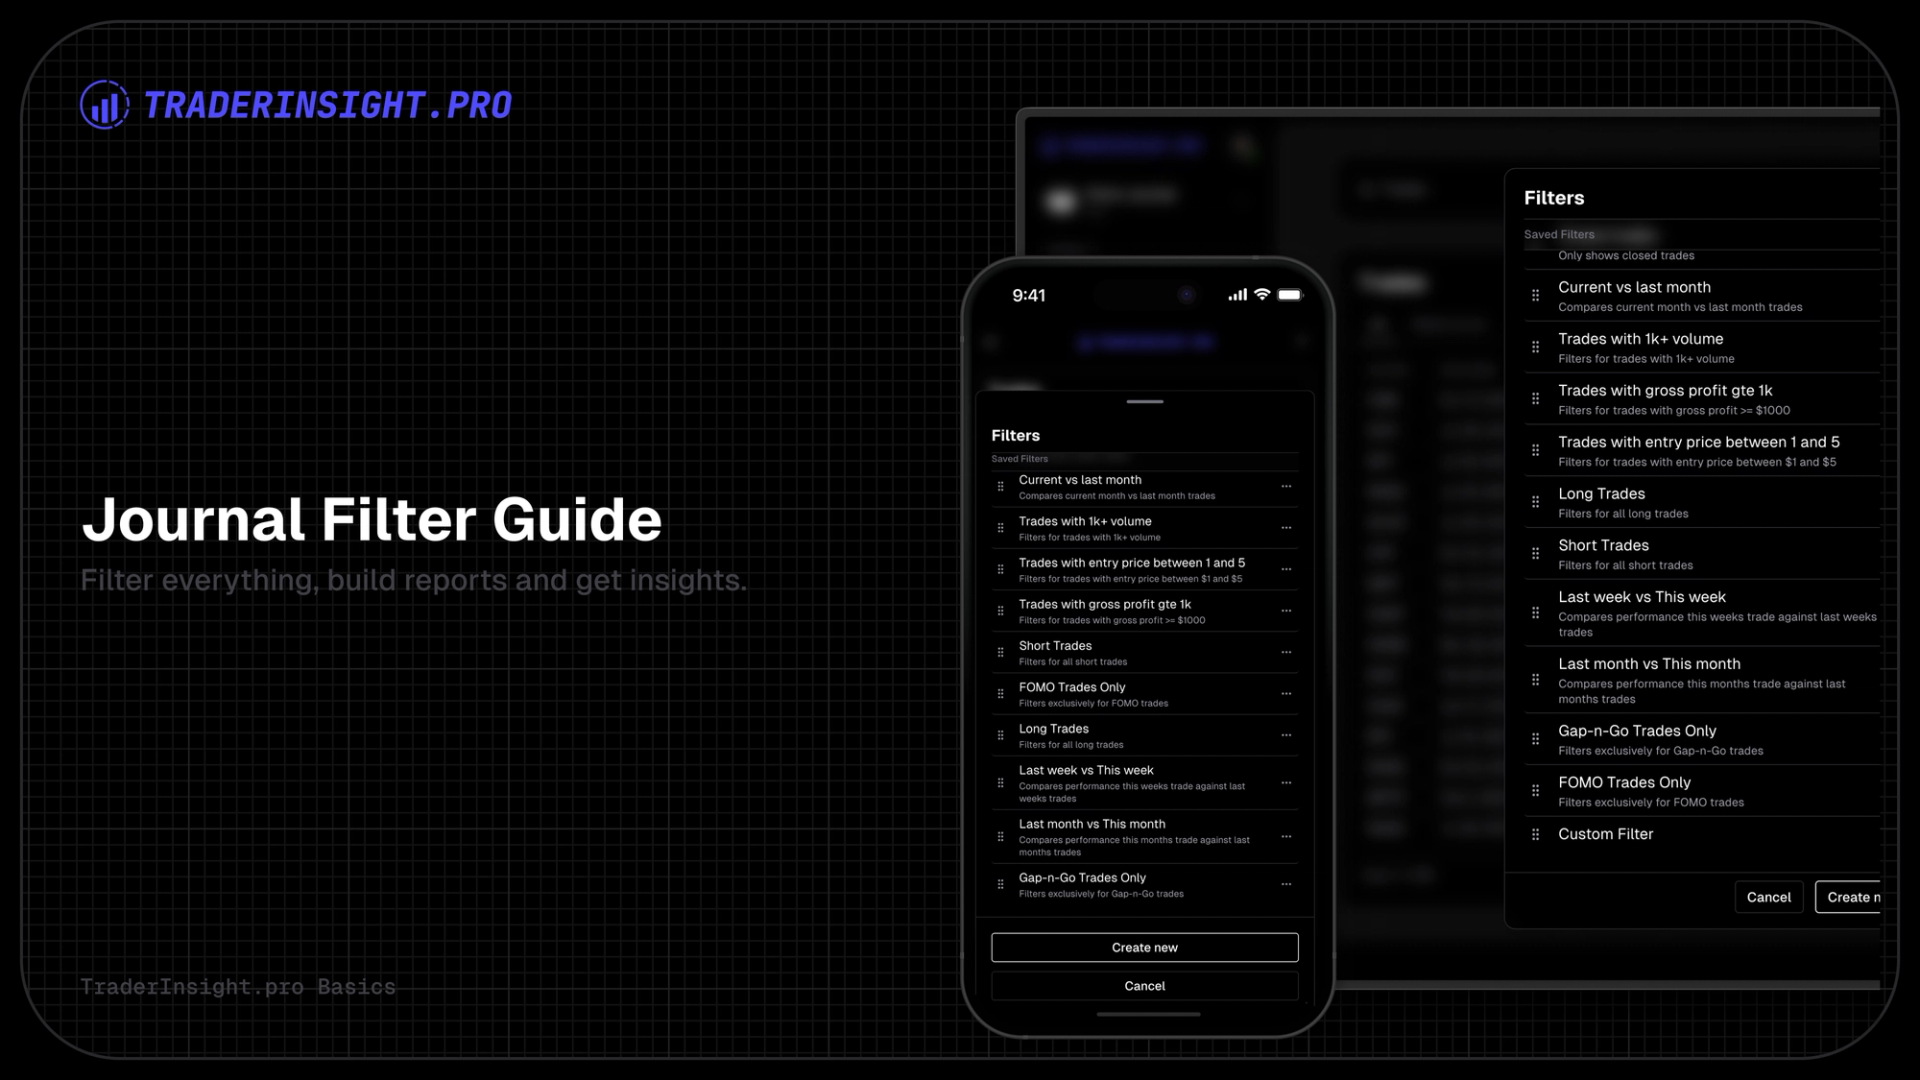
In trading, the difference between good and great often comes down to seeing the right data clearly. TraderInsight.pro doesn't just store your trades - it lets you slice them with precision, turning raw history into actionable insights.
The filtering system is built for traders who demand control: create filters per asset type (stocks, forex, crypto, options, futures), filter on every trade property, layer in custom tags, generate fully customizable performance reports, and run side-by-side comparisons that reveal what actually works.
1. Filters That Work Where You Work
Everything starts in the relevant asset section (e.g., Stocks, Options, Futures). Create as many filters as you need - each one tailored to that asset class. No more scrolling through irrelevant data; your filters stay focused and fast.
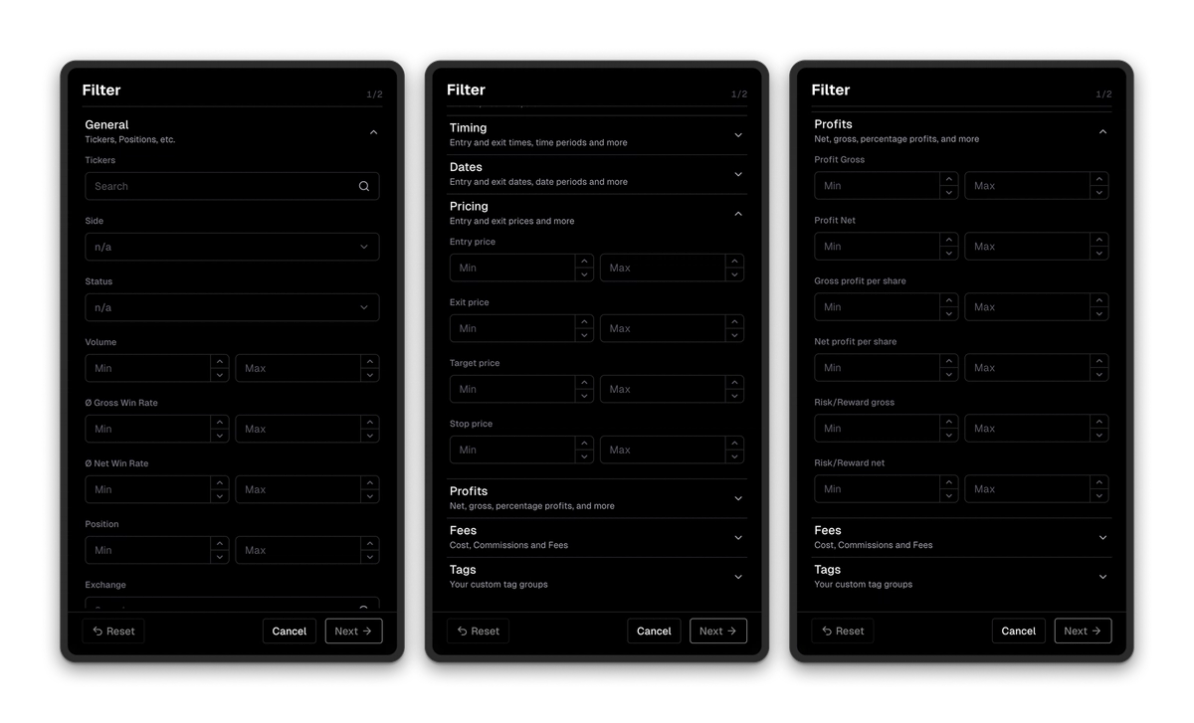
2. Filter on Literally Anything
Open the filter menu and you get access to every single property of your trades:
- Profit/loss (min/max, range)
- Price per share/entry/exit
- Volume
- Trade duration
- And dozens more fields
Want to see only high-volume breakouts with profit > $500? Done in seconds.
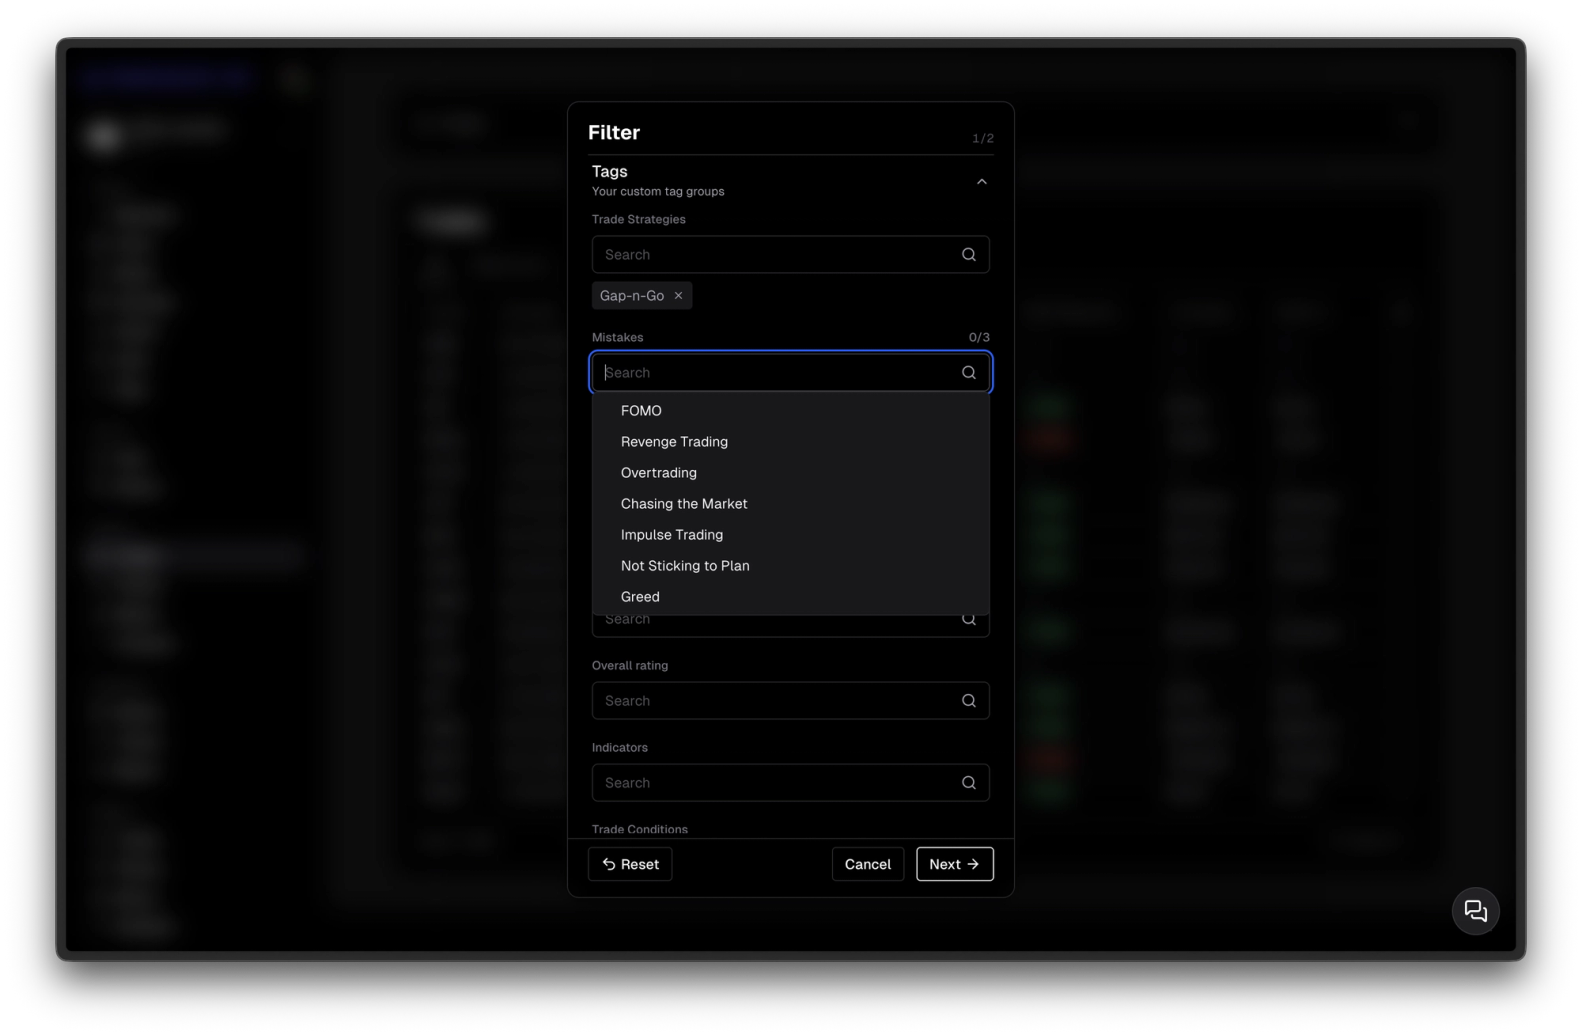
3. Tag & Tag Group Filtering - For Strategies, Setups, Emotions, Anything
Custom tags are your secret weapon. Tag trades with groups like "Strategies" → tags "Breakout", "Gap-N-Go", "Reversal". Or "Emotional State" → "Confident", "Anxious", "Revenge".
Then filter directly on them: show only trades from tag group "Strategies" where tag = "Gap-N-Go". Instant view of exactly the subset you care about.
4. Filters Transform the Trades View
Apply a filter and the Trades list updates immediately - only the matching trades remain. Sort, scroll, inspect - all in context. This is your live, dynamic workspace.
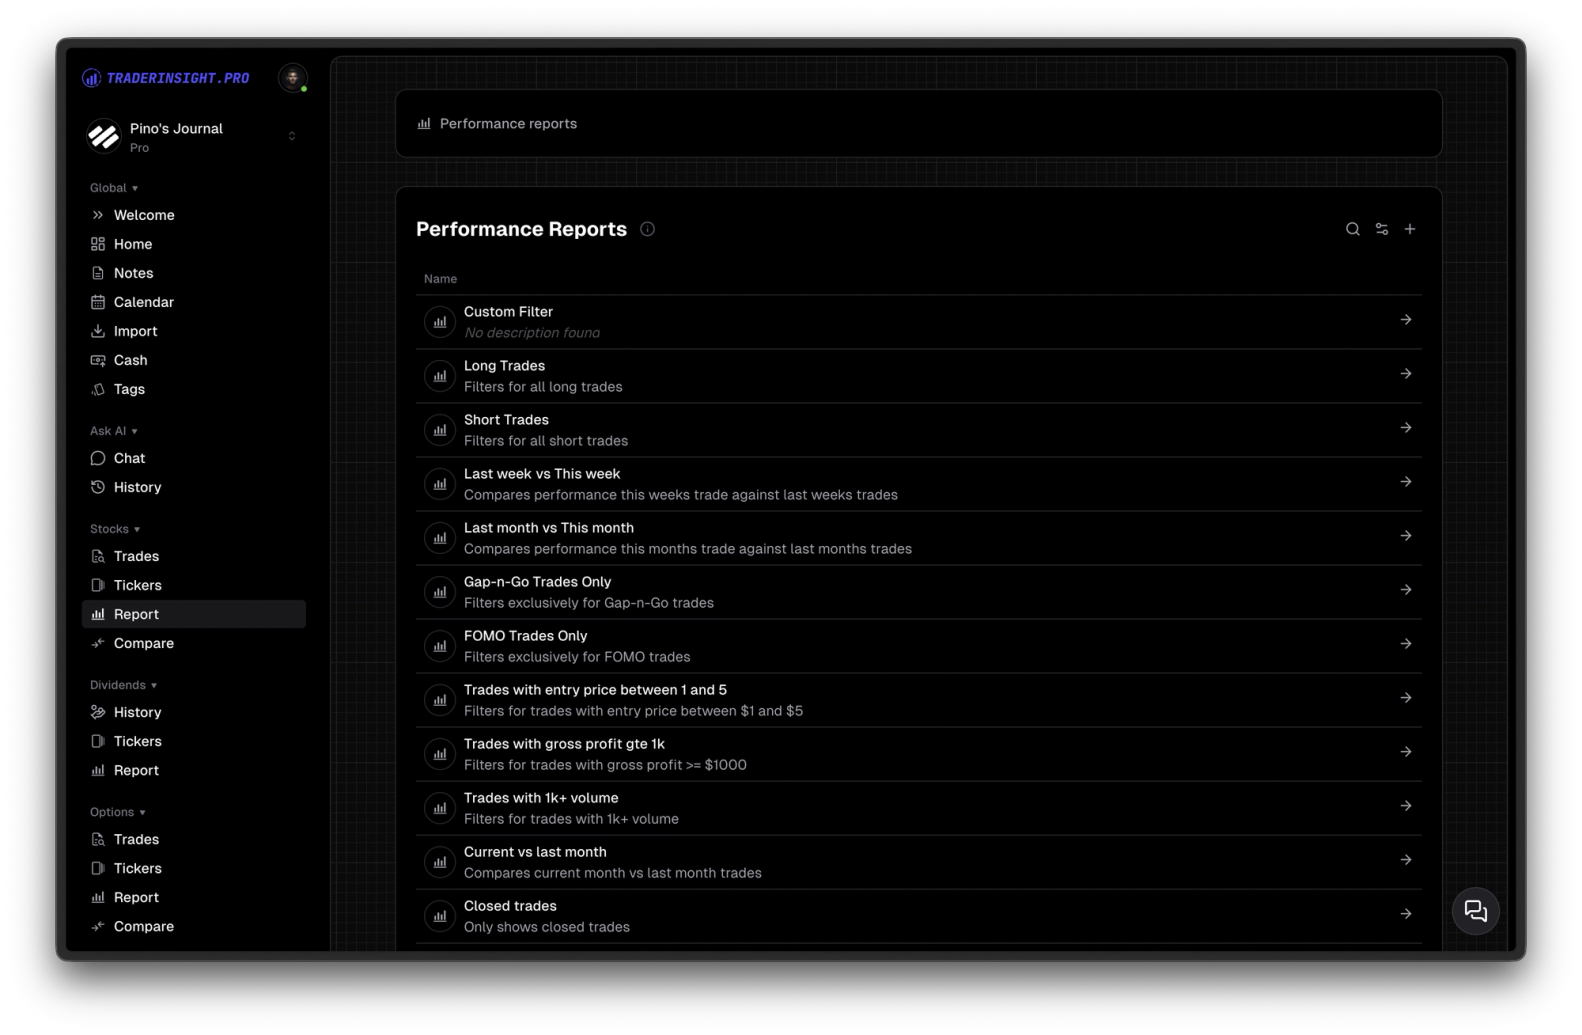
5. Every Filter Creates a Dedicated, Customizable Performance Report
Save any filter and it instantly becomes a full performance report in the Reports section. You get:
- Charts
- Key performance indicators
- Detailed stats
But it's not static. Edit the report: toggle visibility of any KPI, rearrange them, change chart types, adjust axes, add/remove tabs/charts - make it your perfect dashboard for that specific view. No two reports have to look the same.
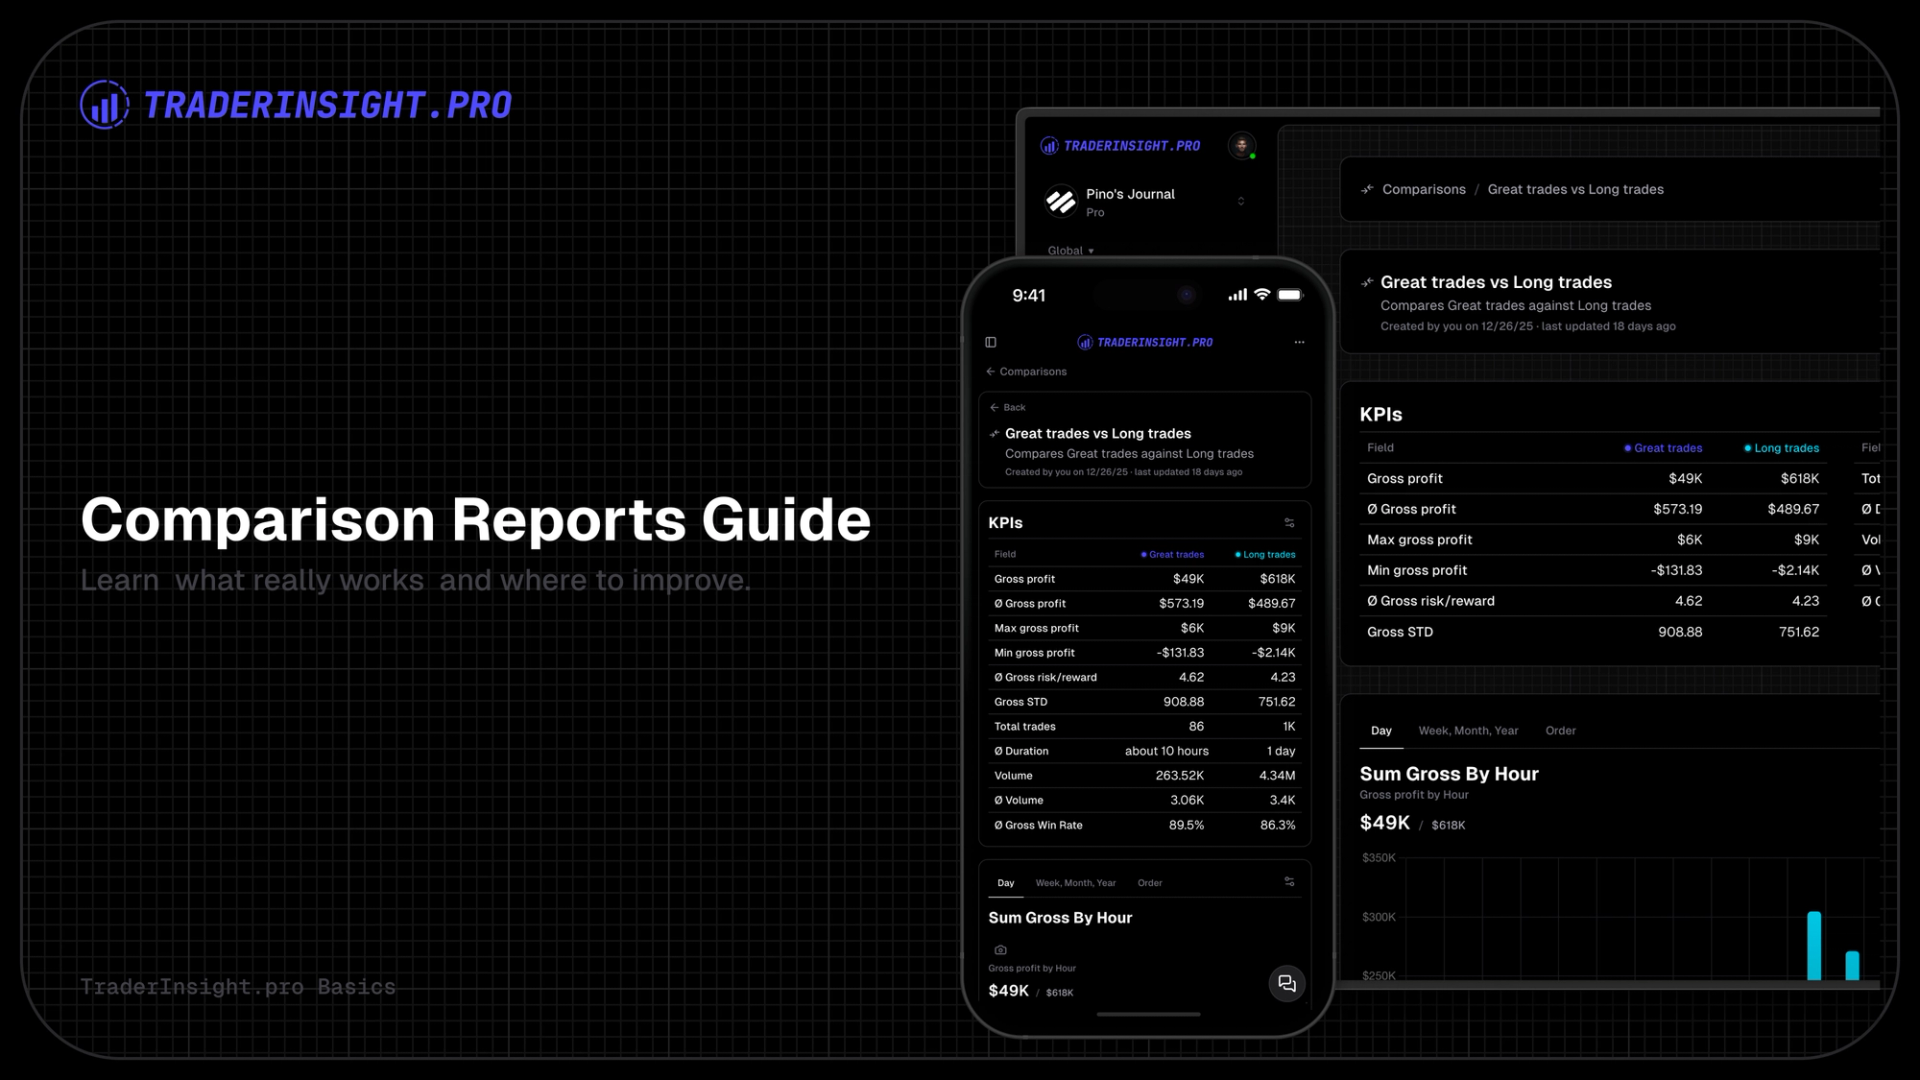
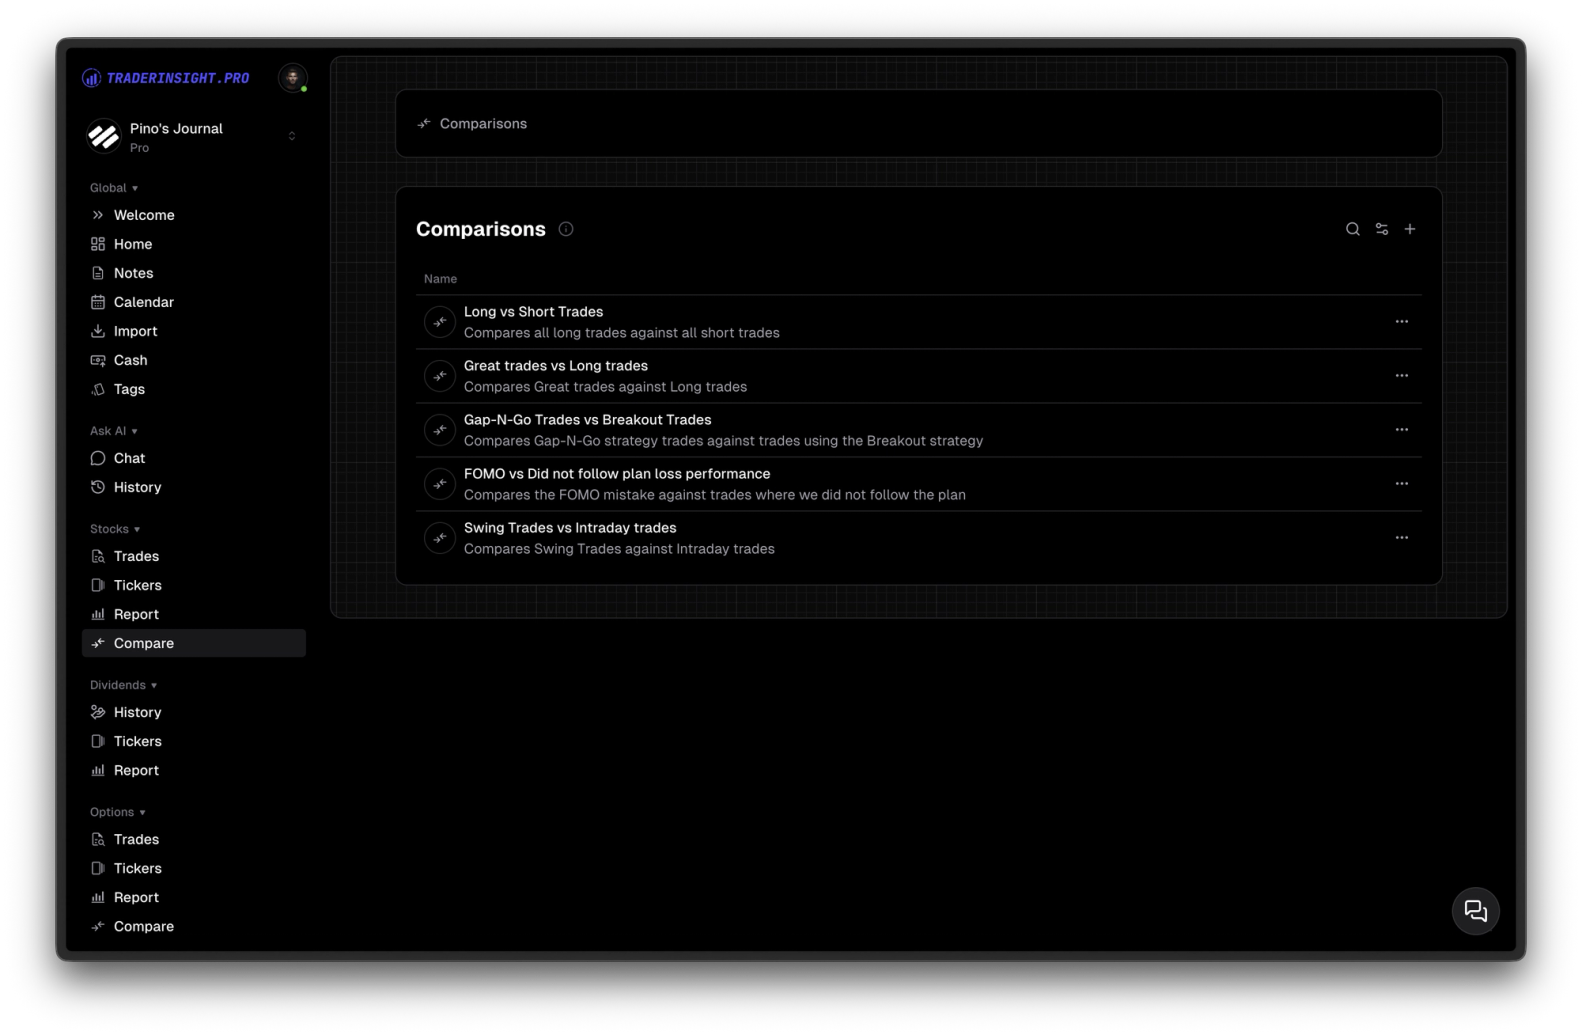
6. Comparison Reports - The Real Power Move
Select two (or more) filters and generate a comparison report. Side-by-side view of everything: win rate, profit factor, drawdowns, holdtimes, etc.
Examples that change how you trade:
- Gap-N-Go vs Breakout strategy performance
- Confident days vs Anxious days
- This month vs last month
- Last year's Q1 vs this year's Q1
This is A/B testing for real traders - clear, visual, data-driven proof of what moves your account forward (and what quietly kills it).
TraderInsight.pro's filtering is the engine that lets you dissect your history, spot hidden edges, kill bad habits, and double down on winners.
Ready to see your trades the way they should be seen? Head to TraderInsight.pro and start filtering.