Table of Contents
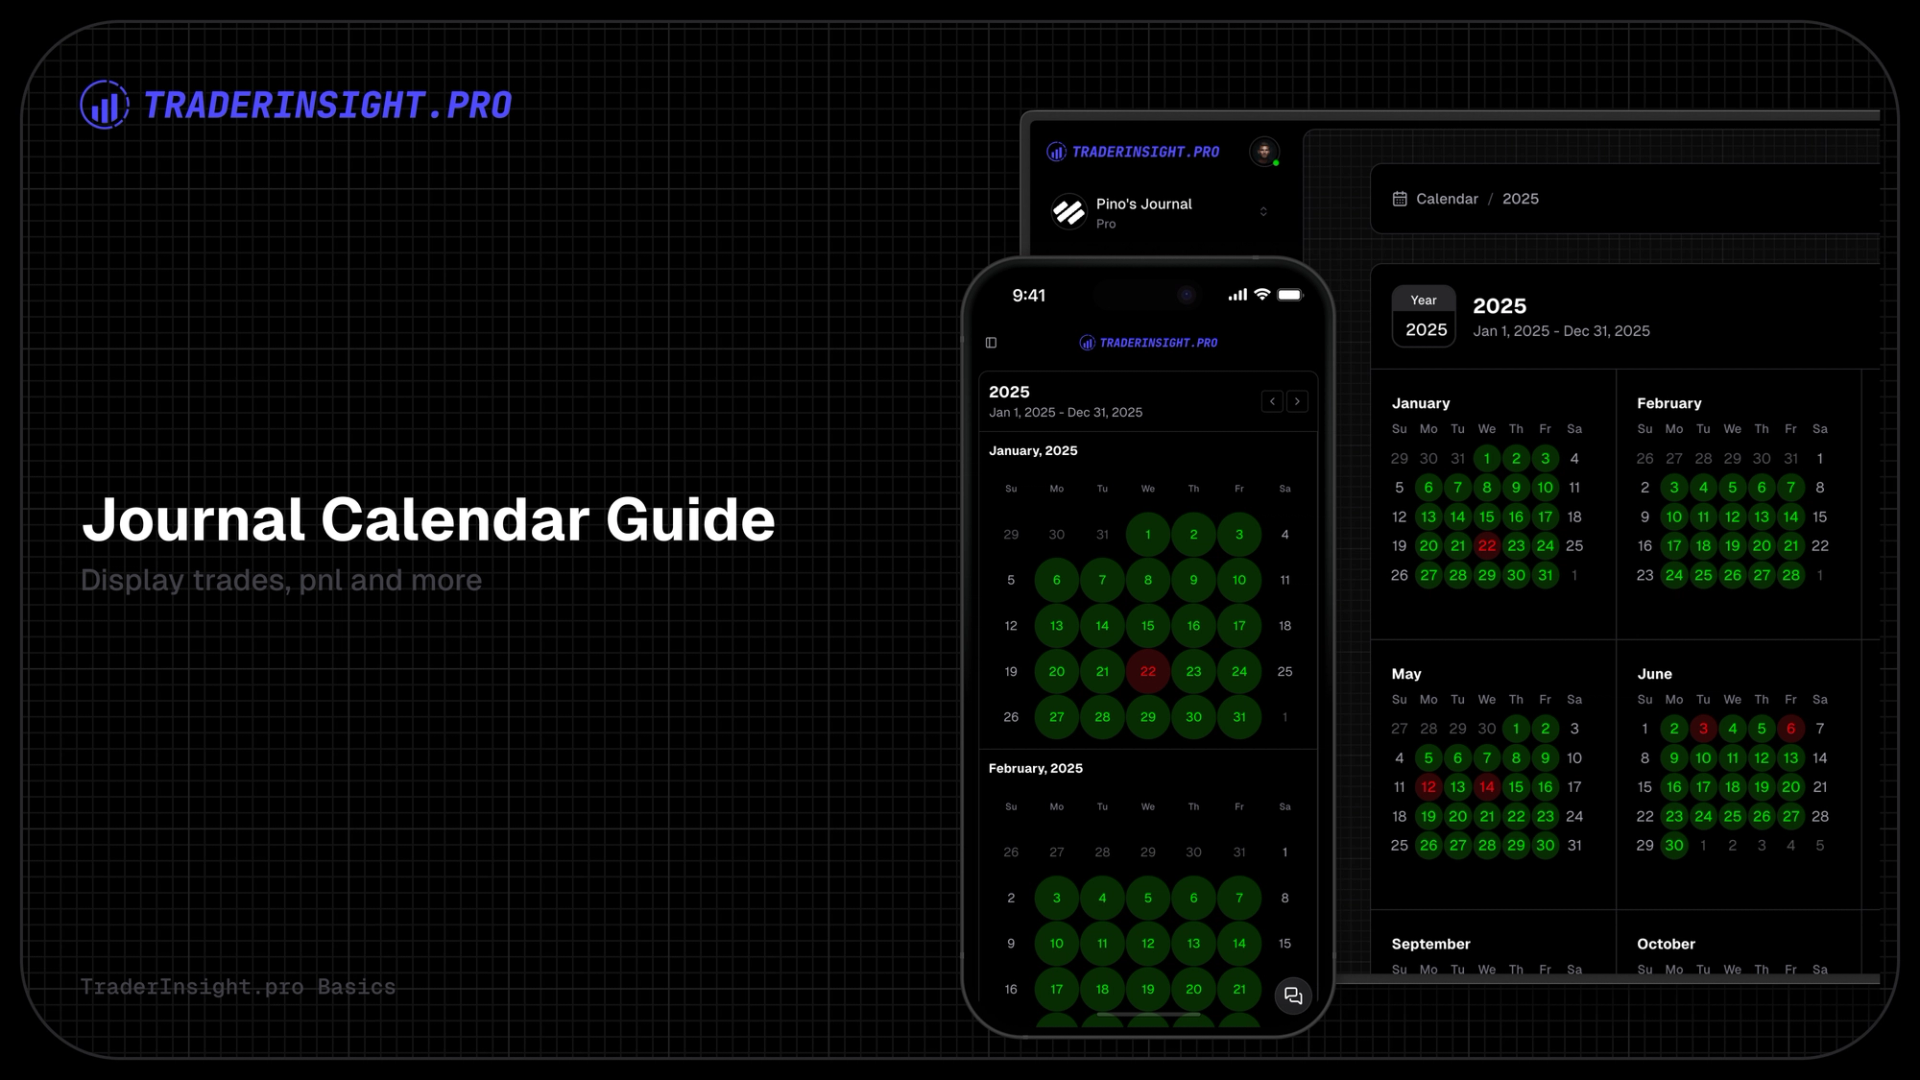
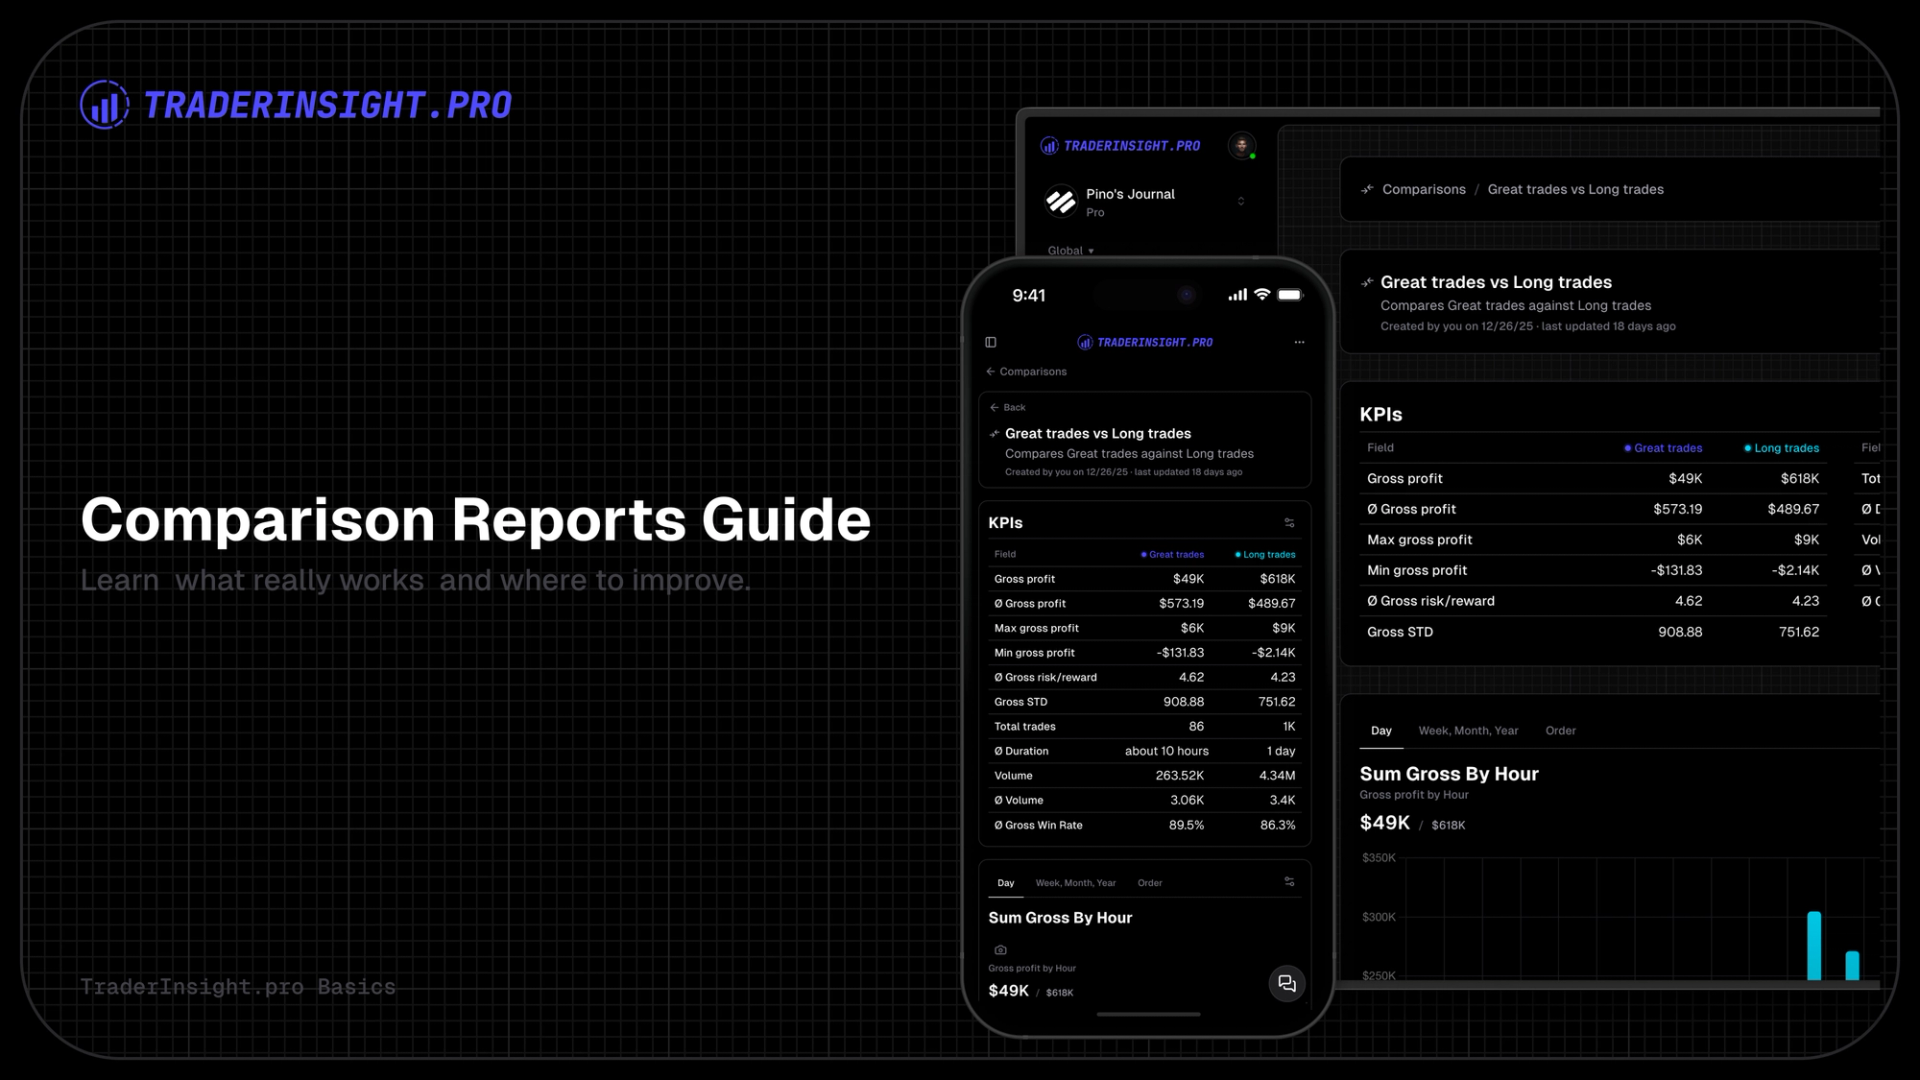
Comparison Reports let you select two or more saved filters and display their results directly next to each other. The platform generates a clear, parallel view of every key metric so you can immediately see which approach, timeframe, condition or tag group delivers superior performance.
This feature builds directly on the filtering system (detailed in the advanced filtering guide). Once you have filters saved, comparisons become the logical next step to turn data into concrete decisions.
What You See in a Comparison Report
TraderInsight.pro creates a fully customizable report.
The top includes the stats overview:
- You can toggle any KPI on or off from an extensive list of available metrics
- Rearrange them in whatever order makes sense to your analysis
Below the stats you will find customizable report tabs with charts:
- View parallel charts for quick visual comparison
- Add and remove charts and tabs with just a few clicks
- Choose from a wide range of different chart types for your data (e.g.
bar,line,area,pie,polar, etc.)
What You Can Compare
You can literally compare anything you are able to filter for. The system doesn't impose restrictions; if you can filter it, you can compare it.
Real-world examples traders regularly use:
- Timeframe comparisons: this month vs last month, this week vs last week, this year vs last year
- Trading styles: trend-following vs mean-reversion, scalping vs swing
- Setup types: Gap-N-Go vs Breakout vs Reversal
- Emotional states: trades tagged “Confident” vs “Anxious” vs “Revenge”
- Market conditions: high-volatility days vs low-volatility days
- Time-of-day patterns: first hour vs lunch hour vs last hour
- Position sizing: large-size trades vs small-size trades
- Risk management: trades with a low risk/reward ratio against high risk/reward ratios
- Day-of-week performances: Monday vs Friday
These direct comparisons reveal patterns that single reports alone rarely expose.
How to Generate a Comparison Report
- Ensure you have at least two saved filters in the desired asset section
- Navigate to the Compare section in the sidebar
- Select your filters from the dropdowns
- Click Generate
The report is ready instantly and fully editable.
Customization & Reuse
Open edit mode to:
- Toggle, rearrange or hide KPIs
- Adjust chart types and axes
- Add or remove tabs
- Save the customized version for future use
Your comparisons evolve as your questions change.
Closing Note
Comparison Reports are one of the fastest ways to move from "I think this works" to "the data proves it works".
Start with two simple filters, run a quick comparison, and you'll immediately see why so many of our traders consider this their most valuable analysis tool.
Head to your account, pick two filters, and generate your first comparison today. The clarity is addictive.
Get started today.