Table of Contents
TraderInsight.pro gives you three powerful calendars to instantly visualize your trading results, spot winning (and losing) patterns, and keep your edge razor-sharp - without digging through endless spreadsheets.
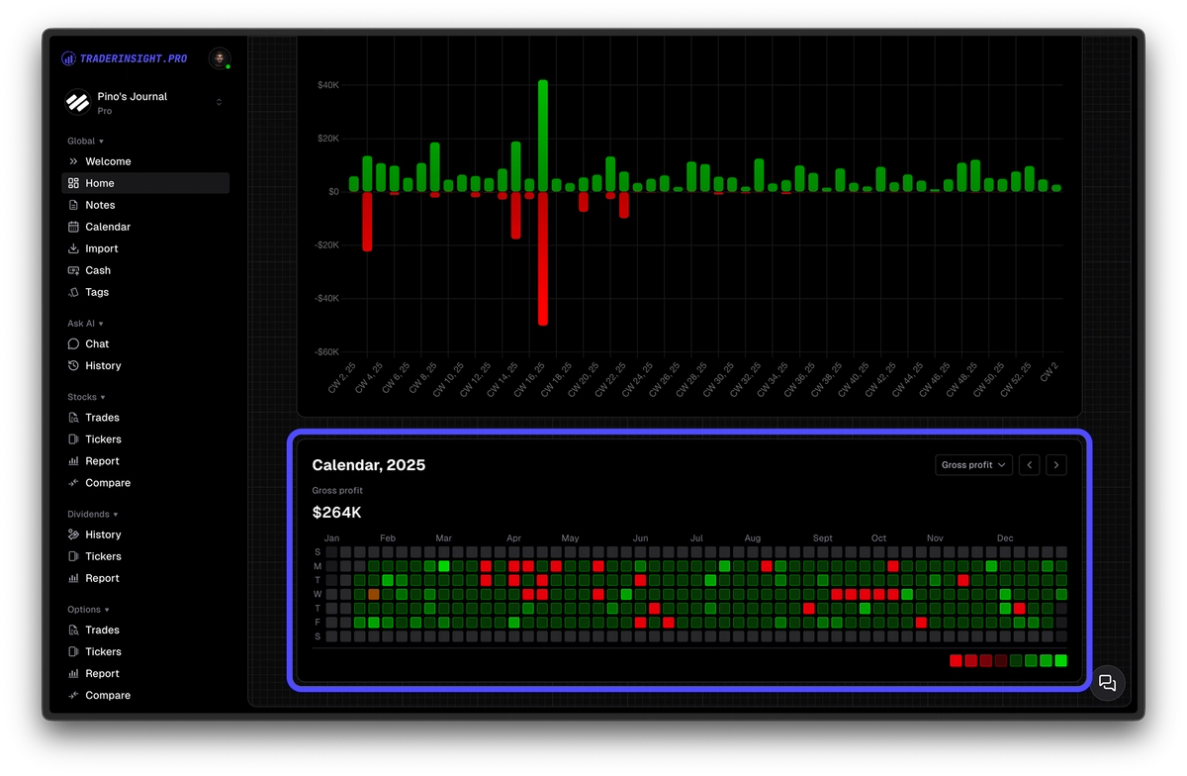
1. Dashboard Calendar - Your Quick Daily Snapshot
Right on the main dashboard, at the bottom, you'll find the compact calendar. This is your at-a-glance pulse check:
- Days dynamically shift through multiple shades of green for profits - the stronger the win, the more vibrant the green.
- Losses go the other way: multiple deepening levels of red, scaling to the size of the drawdown.
- The intensity levels are calculated automatically based on your personal profit/loss range - so the visualization always reflects the real story of your account.
Click any day to open the full list of closed trades from that session - neatly organized by asset type for quick review.
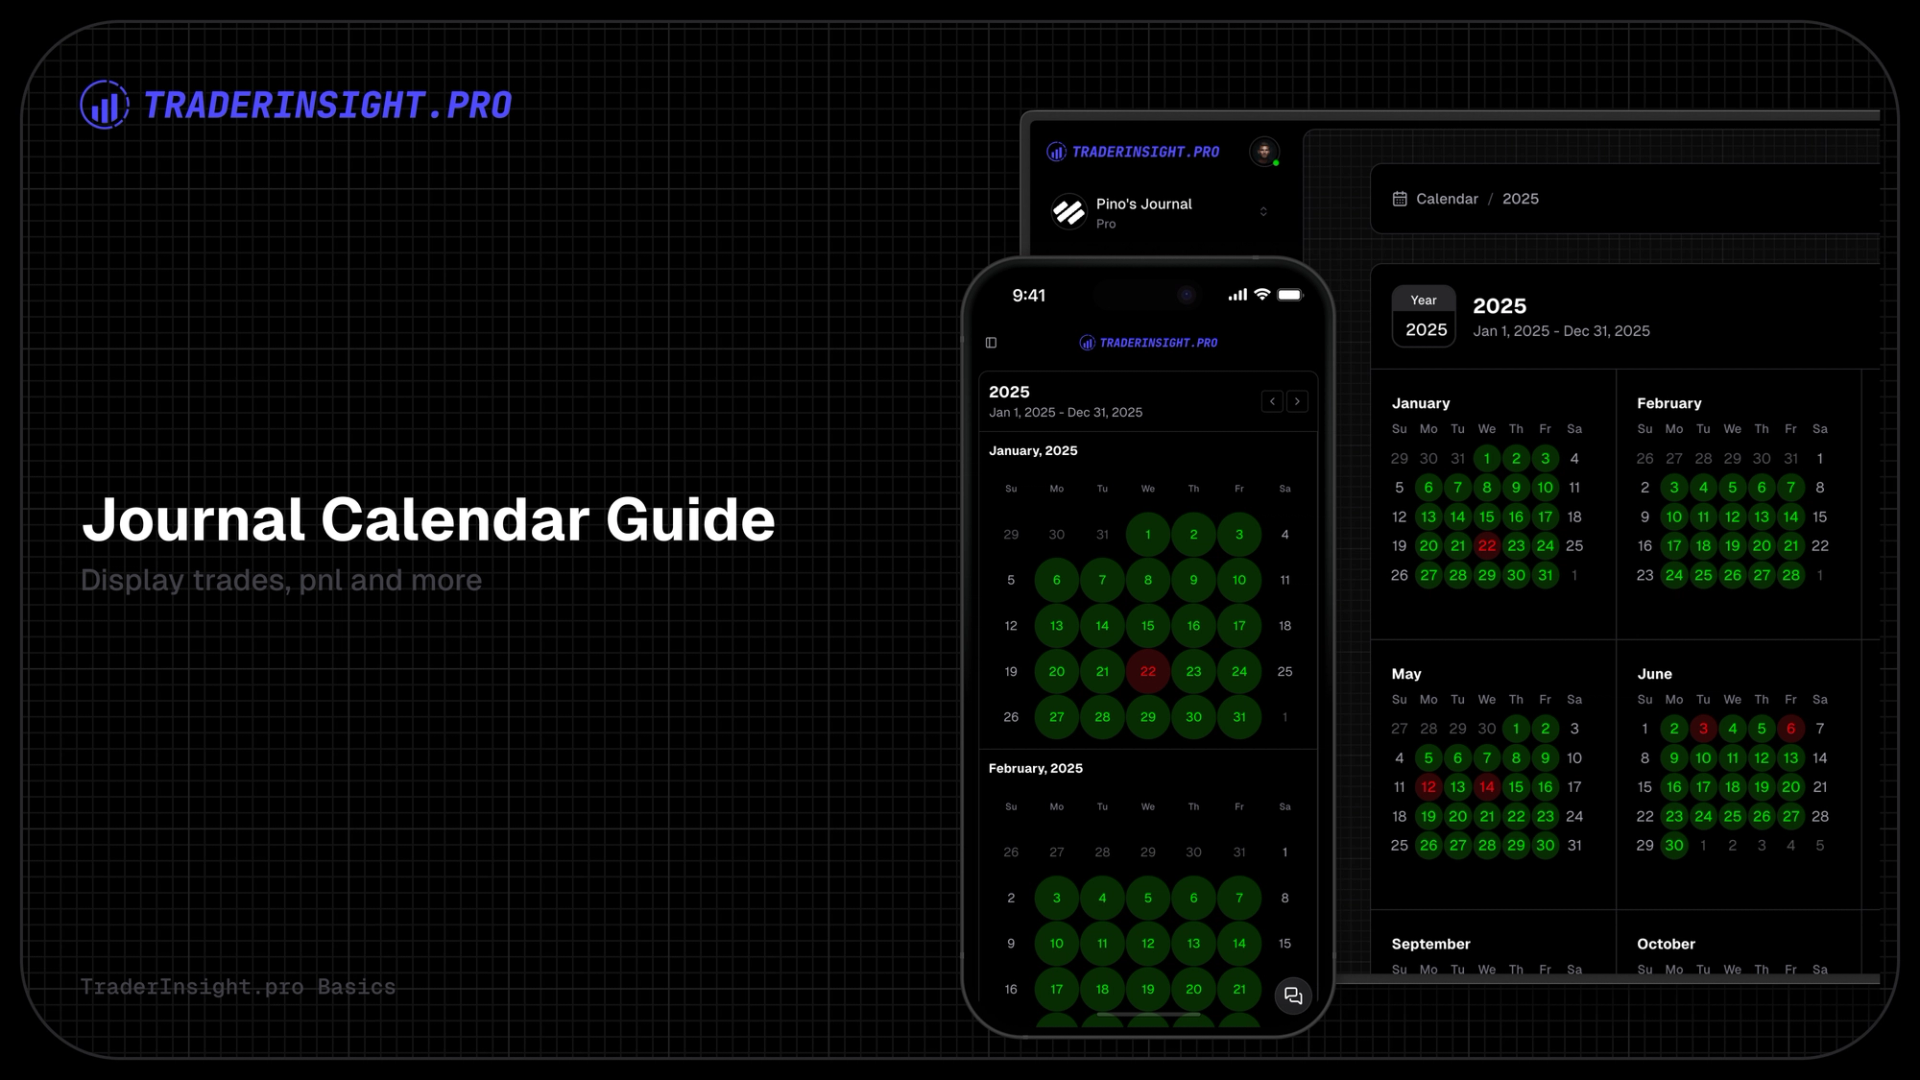
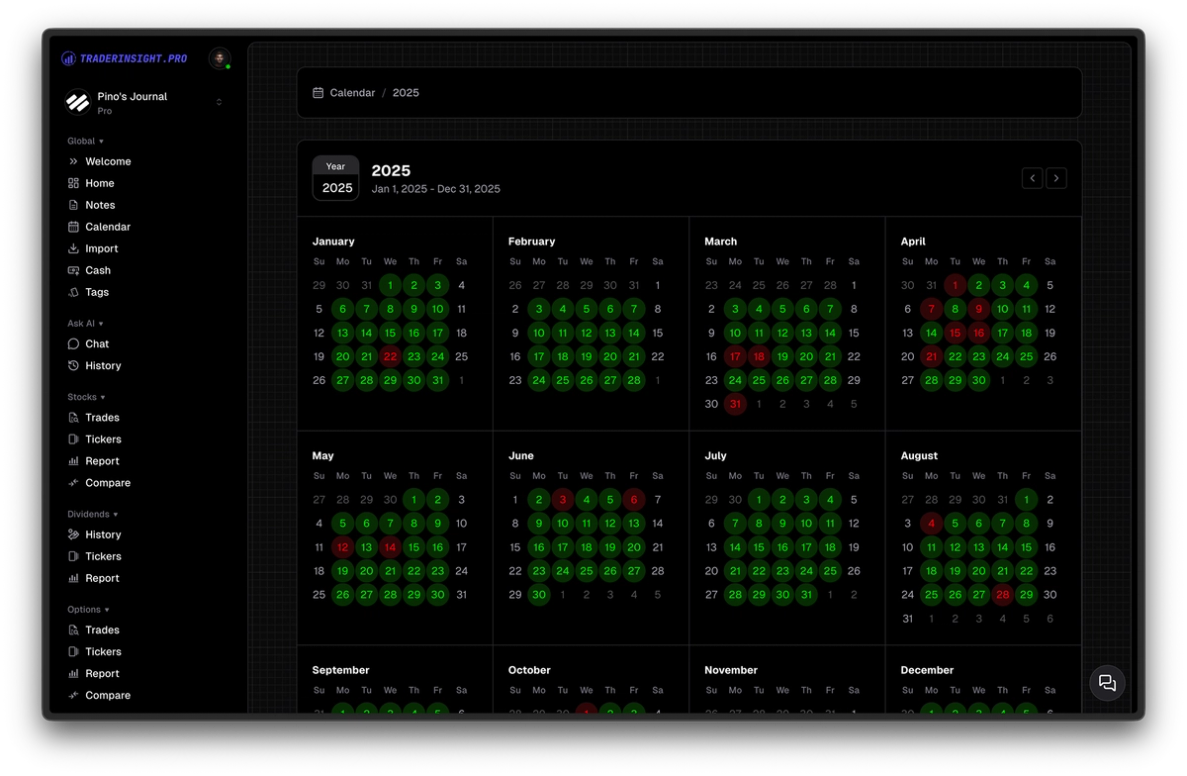
2. Full-Year Calendar View - Your Big-Picture Command Center
Switch to the dedicated full-year calendar for the ultimate overview. Flip through years effortlessly and see the same dynamic coloring in action:
- Multi-level green for wins
- Deepening red for losses
- All scaled intelligently to your own data
Click a single day or an entire month to dive deeper. You'll instantly see key performance metrics:
- Average win rate
- Total profit
- Trade count
- And more
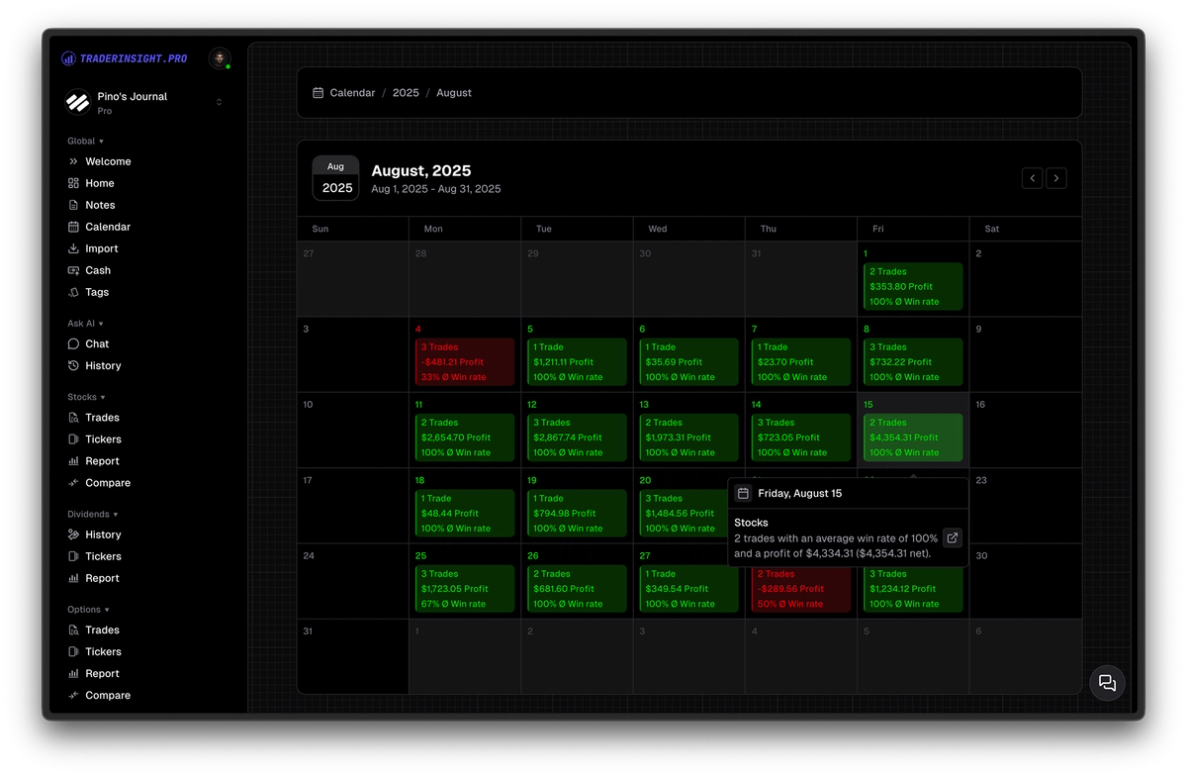
One more click reveals every individual trade from that period.
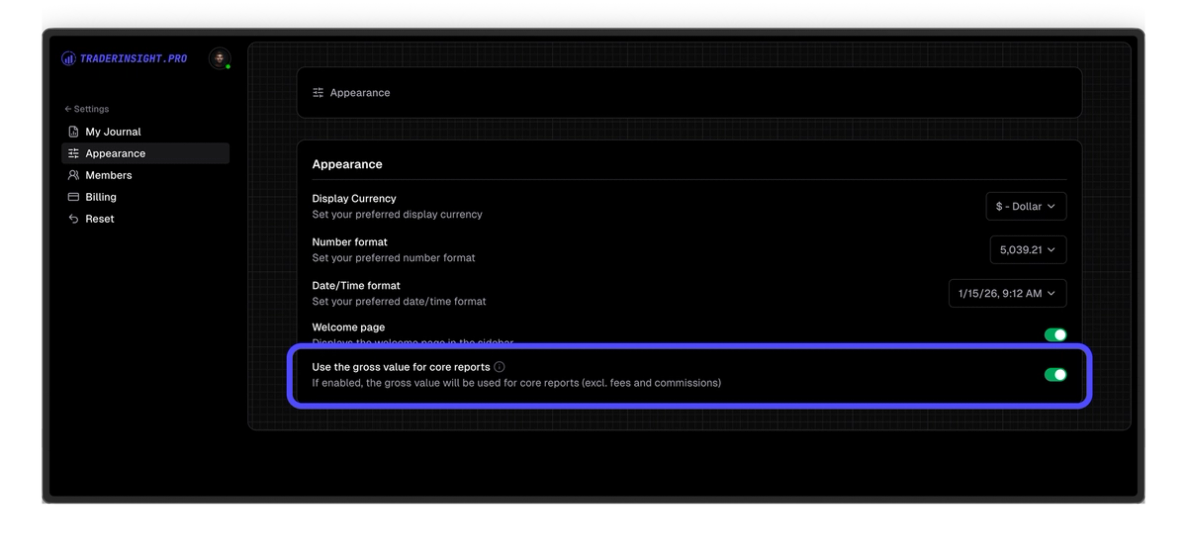
3. Customize Your Profit View (Net or Gross)
Want the calendars to match exactly how you evaluate your performance? Head to Journal Settings and choose:
- Net profit (after commissions, fees, etc.)
- Gross profit (raw P&L before costs)
Your entire calendar system updates instantly - dashboard, full-year view, everything - scoped to your preferred metric. No surprises, just your numbers the way you trade them.
Why This Matters
These aren't just pretty colors. The TraderInsight.pro calendar system is visual, interactive, and built to reveal what really drives your results - day by day, month by month, year by year.
Import anything. Analyze everything. Journal everywhere.
That's TraderInsight.pro.
Watch the step-by-step video for a live walkthrough, or jump straight into your account and explore the calendars today.
The calendars currently show only trade relevant information. Dividends and cash transactions will be added in the coming weeks and months.