Table of Contents
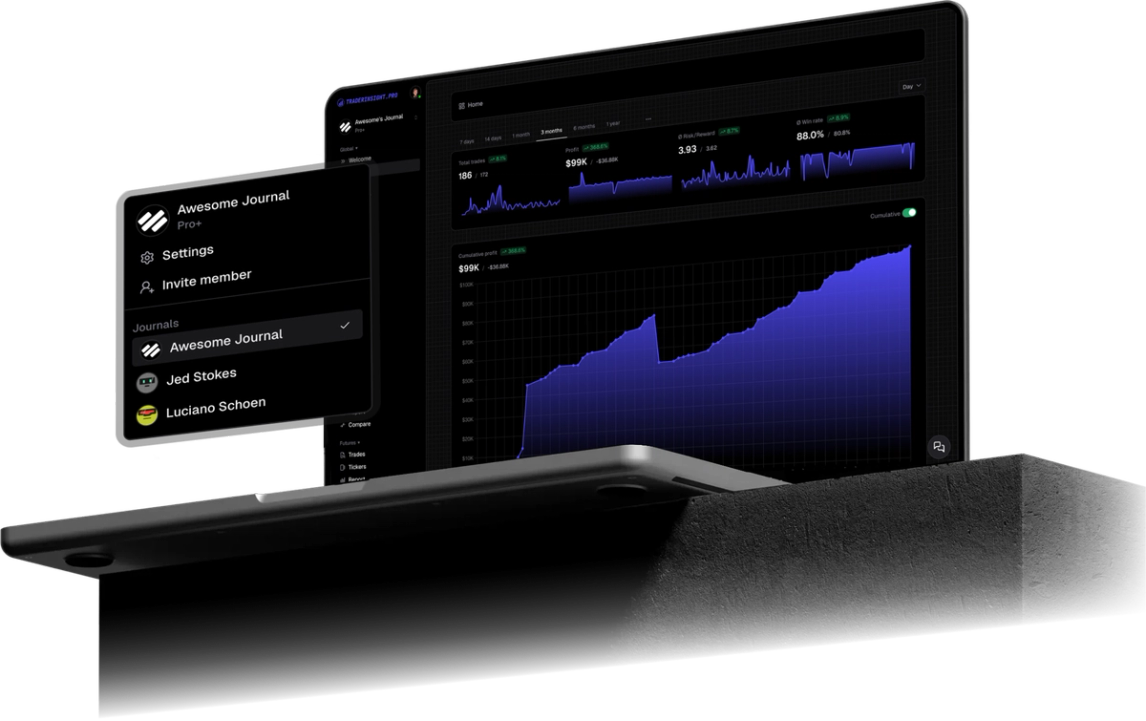
At TraderInsight.pro, we know how crucial it is to stay on top of your trading performance. That's why our Dashboard is designed to give you quick, actionable insights, all in one place. Here's a breakdown of how you can make the most of it.
Track Your Performance with KPIs
Your trading journey is defined by key metrics, and our Dashboard puts them front and center. The top row displays your Key Performance Indicators (KPIs), giving you a snapshot of your performance at a glance. Want more details? Simply click on any KPI to see the data reflected instantly in the Main Chart below. This makes it easy to drill down into specific metrics and understand the underlying trends.
Personalize Your Dashboard
We understand that every trader has unique needs, which is why the Dashboard is fully customizable. Use the dropdown menu in the top right corner to group your data by criteria like weekday, day of the month, or even all-time performance.
To further tailor the experience, you can customize the KPIs that are displayed. The Display menu allows you to show or hide specific KPIs, as well as reorder them with a simple drag-and-drop. Once you’ve set it up the way you like, just hit Save to lock in your preferences.
Analyze Your Trades with the Ticker Chart
The Ticker Chart on the Dashboard aggregates all the stock tickers you’ve traded. This chart is dynamic, letting you group data by Gross Profit, Net Profit, Trade Count, and more. It's a powerful tool for spotting which tickers are driving your profits - and which ones aren’t.
Visualize Your Profitability with the Calendar
At the bottom of the Dashboard, you'll find the Calendar - a dynamic, color-coded heatmap that provides a yearly view of your trading performance. This isn’t just any calendar - it's designed to give you an immediate sense of how your trading days have gone. Days with higher profitability glow in green, while days with losses are marked in red. The intensity of the color correlates with the size of the profit or loss, giving you an at-a-glance understanding of your trading history.
Need to dive deeper? Click on any date in the Calendar, and you'll be taken directly to the Trades page, where you can review all the trades executed on that day.
Effortless Filtering for Clearer Insights
To help you focus on the data that matters most, the Dashboard includes robust filtering options. With just a couple of clicks, you can compare your current month's performance against the previous month’s, helping you quickly identify trends and adjust your strategies accordingly.
Conclusion
The TraderInsight.pro Dashboard is more than just a collection of charts and graphs - it's a tool designed to help you maximize your trading potential. By offering comprehensive, customizable insights into your performance, it empowers you to make data-driven decisions with confidence. Dive in today and take control of your trading journey!