Table of Contents
From today, every ticker in your stocks, options, dividends and futures journal is a live link. Click any symbol - from your ticker table, a trade row, or a dividend modal - and you instantly land on a full ticker report page built around that instrument. Live price chart, bid/ask spread, company fundamentals, analyst buy/sell/hold ratings from top institutions, upcoming dividend payout dates, top news stories, and your own P&L and win rate for that ticker. All in one place. No tab-switching, no copy-pasting tickers into a separate tool, no context lost.
This is one of the biggest upgrades to ticker reports in TraderInsight.pro - and it's available on every plan, for free, starting today.
Why this is a bigger deal than it sounds
Most traders already know roughly which symbols they trade the most. What they don't have is an easy way to combine that knowledge - their own win rate, their own P&L history on a symbol - with what's actually happening in the market around it. Is the analyst consensus shifting? Is there a dividend coming up that might move the stock? Did you trade through a news cycle you weren't aware of? These are the questions that separate a good post-trade review from a shallow one.
Until now, answering them meant leaving TraderInsight.pro entirely. Pull up a chart in one tab, check analyst ratings in another, look up the dividend schedule somewhere else. Every tool switch is friction. Friction kills the review habit. And it's the review habit - more than any single trade - that actually makes traders better over time.
Ticker reports close that loop. Your journal already knows every symbol you've ever touched. Now it can show you everything that matters about those symbols too, right alongside your own data.
What's on a ticker page
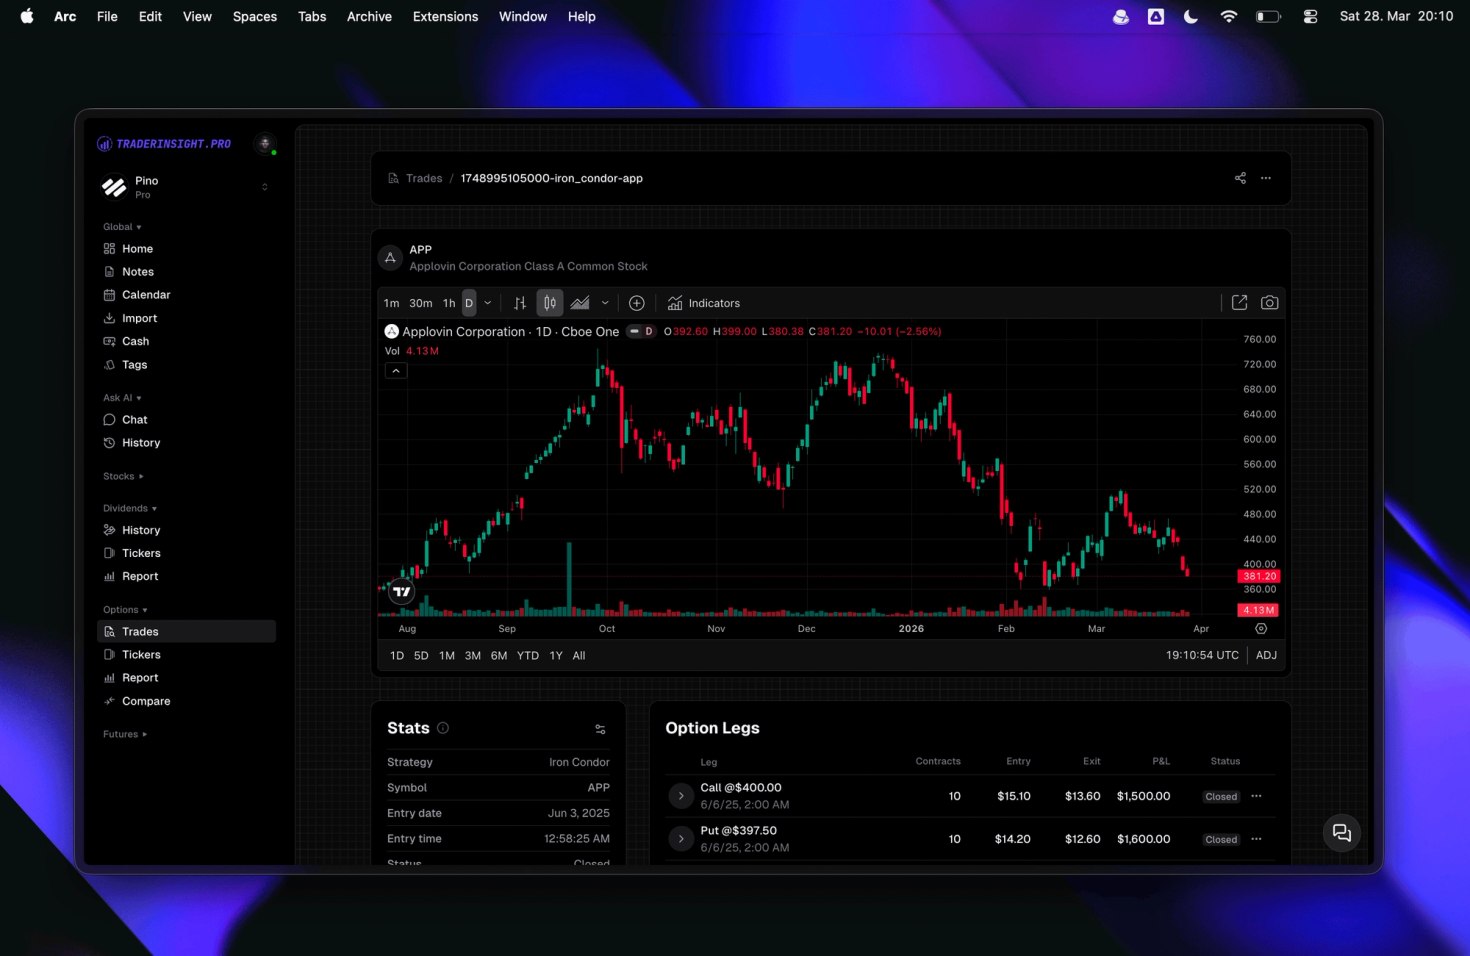
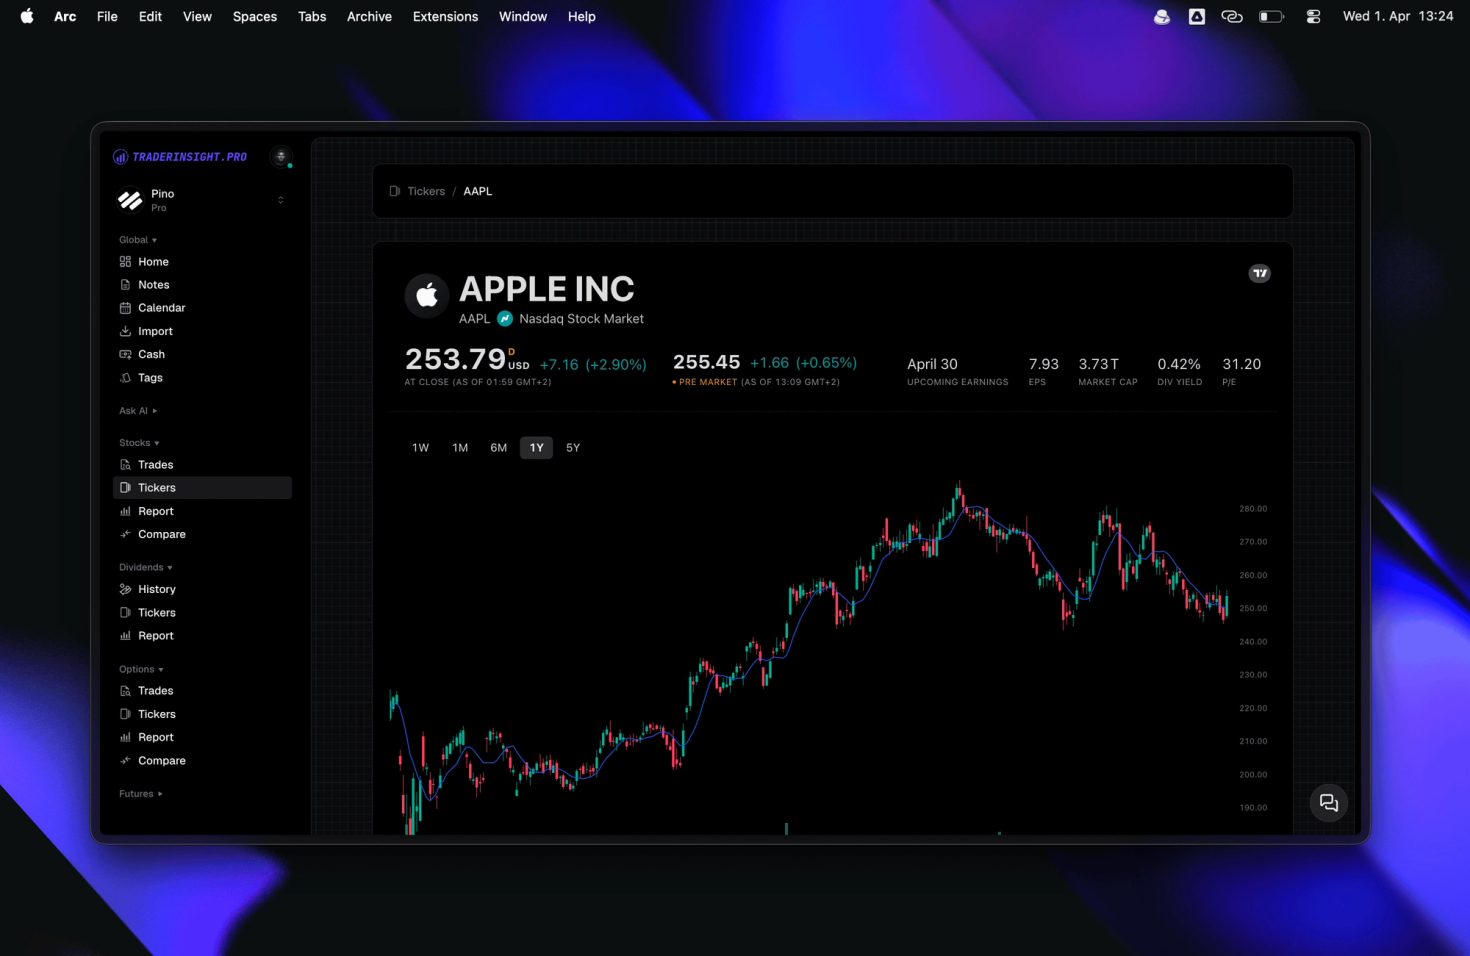
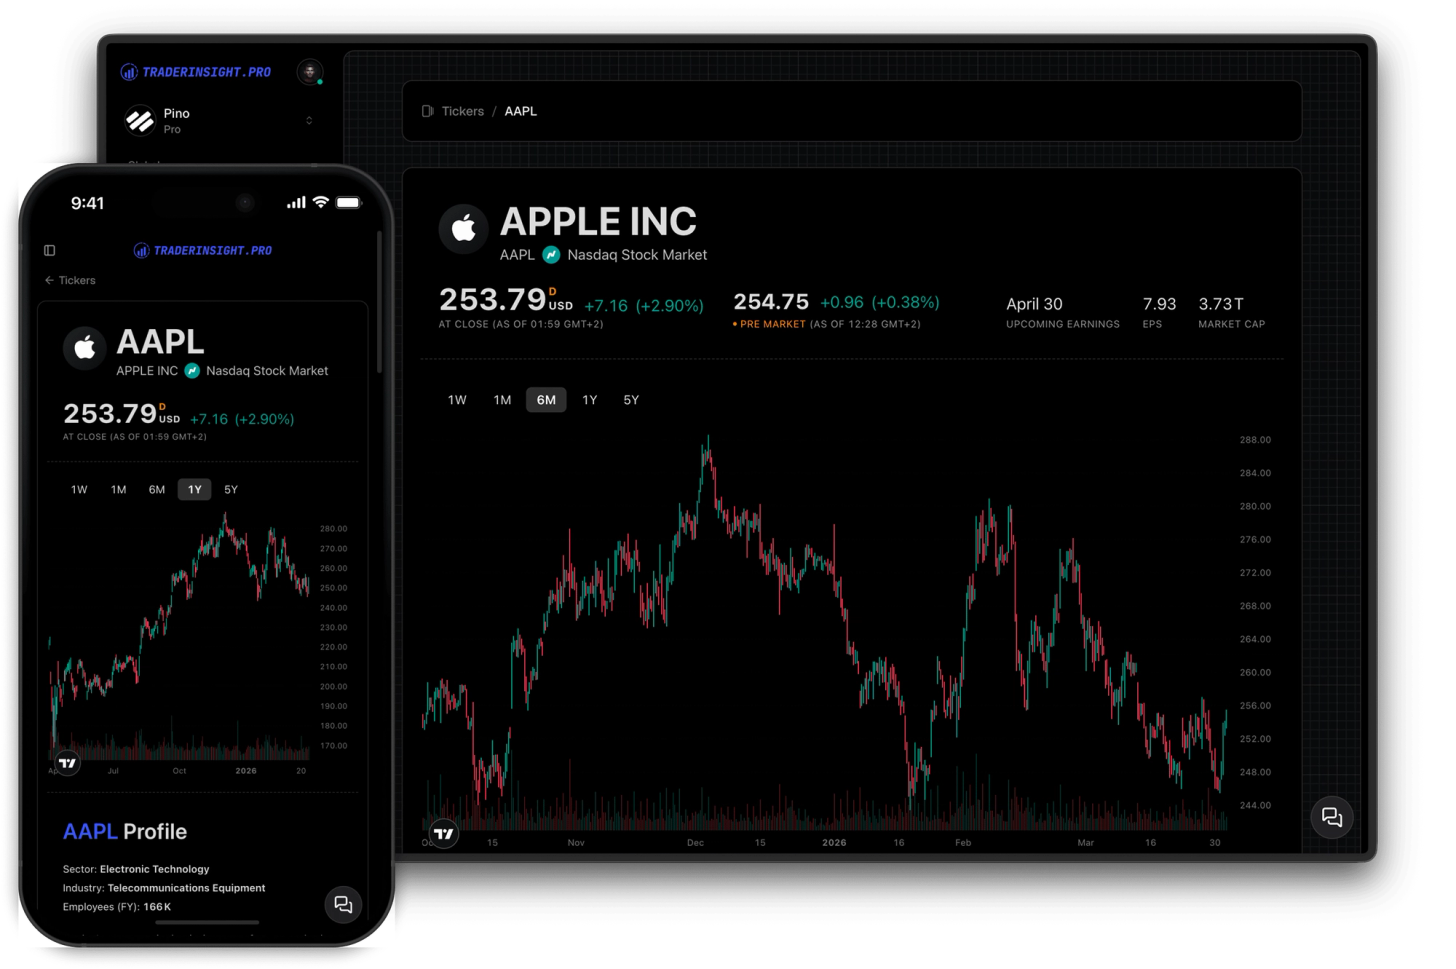
Each ticker page combines live market data with your personal journal stats for that instrument:
- Live price chart - a full TradingView chart embedded directly, with real-time price and bid/ask spread
- Price history - full historical chart so you can see how the symbol has moved over any timeframe
- Company fundamentals - P/E, EPS, market cap, sector, revenue and more for the instruments you trade
- Analyst ratings - official buy, hold, and sell ratings from top institutions, updated in real time
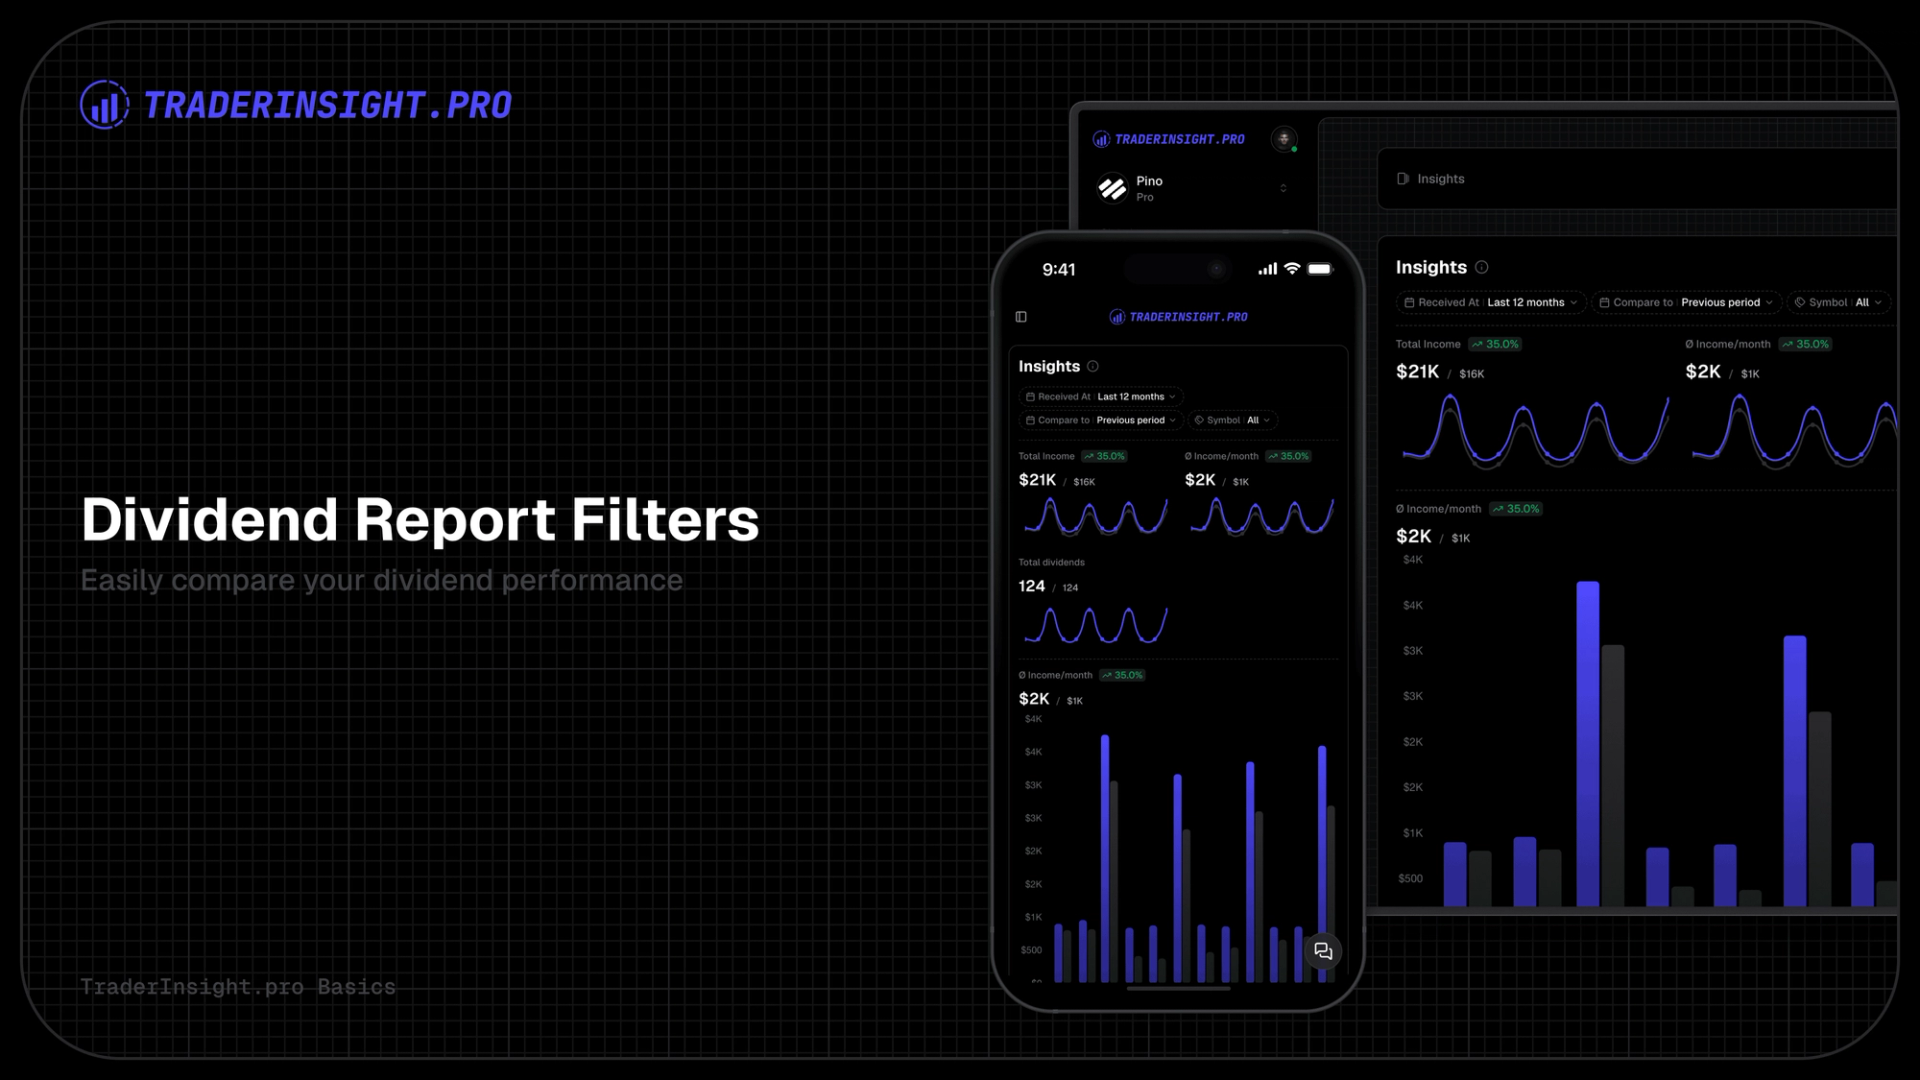
- Dividend schedule - upcoming and historical payout dates shown alongside your own dividend records
- Top stories - the latest news headlines for that symbol so you always have context
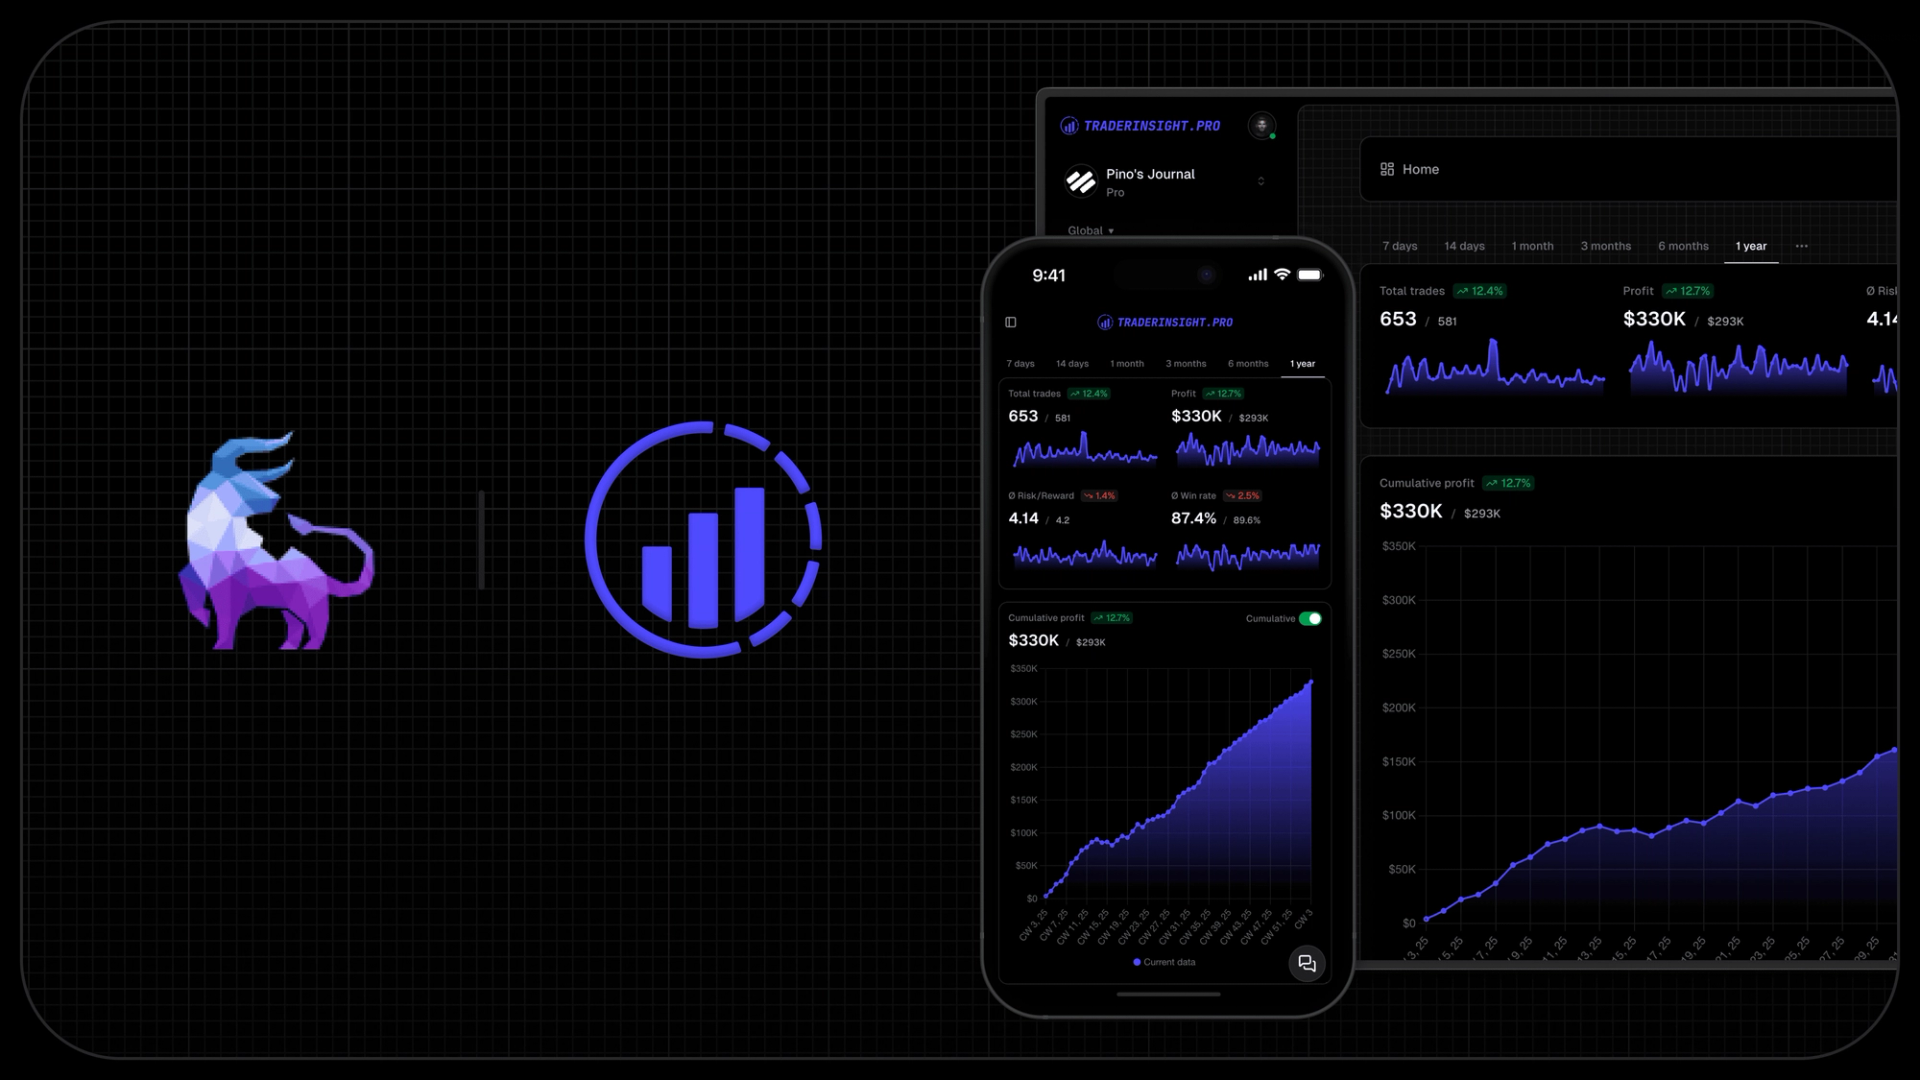
- Your own performance stats - your total P&L, win rate, and trade count for that ticker, pulled straight from your journal
The combination of market data and your personal trading history in a single view is what makes this genuinely useful for review sessions. You're not just looking at a chart - you're looking at a chart you've actually traded, alongside the real-world context that surrounded those trades.
How to get to a ticker page
There's no new section to navigate to. In the sidebar, each asset group - stocks, options, dividends, futures and more - has a Tickers entry. Click it, and every symbol you've traded in that group is listed. Click any symbol and you land on its ticker page instantly. You can also click any ticker symbol directly from a trade row or from inside a dividend modal - the link is everywhere you'd naturally look for it.
How ticker reports fit into your review workflow
The most effective use of ticker pages is in your post-session or end-of-week review. After logging your trades and tagging them with your strategy and mistake tags, open the tickers table and drill into the symbols that had the biggest impact on your P&L that session - positive or negative.
On the ticker page, you can cross-reference your own performance stats with the live chart and recent news. Did you take a loss on a symbol right before a catalyst you didn't know about? Did your win rate on a particular ticker drop over the last month while analyst sentiment was quietly shifting? These are the patterns that are almost impossible to spot when your journal data and market data live in separate tools.
Pair this with AI analysis to ask plain-language questions about your performance on specific symbols, and with performance reports to compare your results across tickers, timeframes, and strategies. Add structured trade notes to capture observations directly from your review session. Ticker pages slot into all of it - they're not a standalone feature, they're the missing context layer that makes everything else sharper.
Available on all plans, for free
Ticker pages are live on all plans today. There's nothing to enable - just open your journal, find any ticker, and click it.
This is also just the foundation. Ticker pages will get deeper over time. If there's something you'd want to see there - additional data, tighter integration with your trade history, or anything else - let us know. We ship fast.