Table of Contents
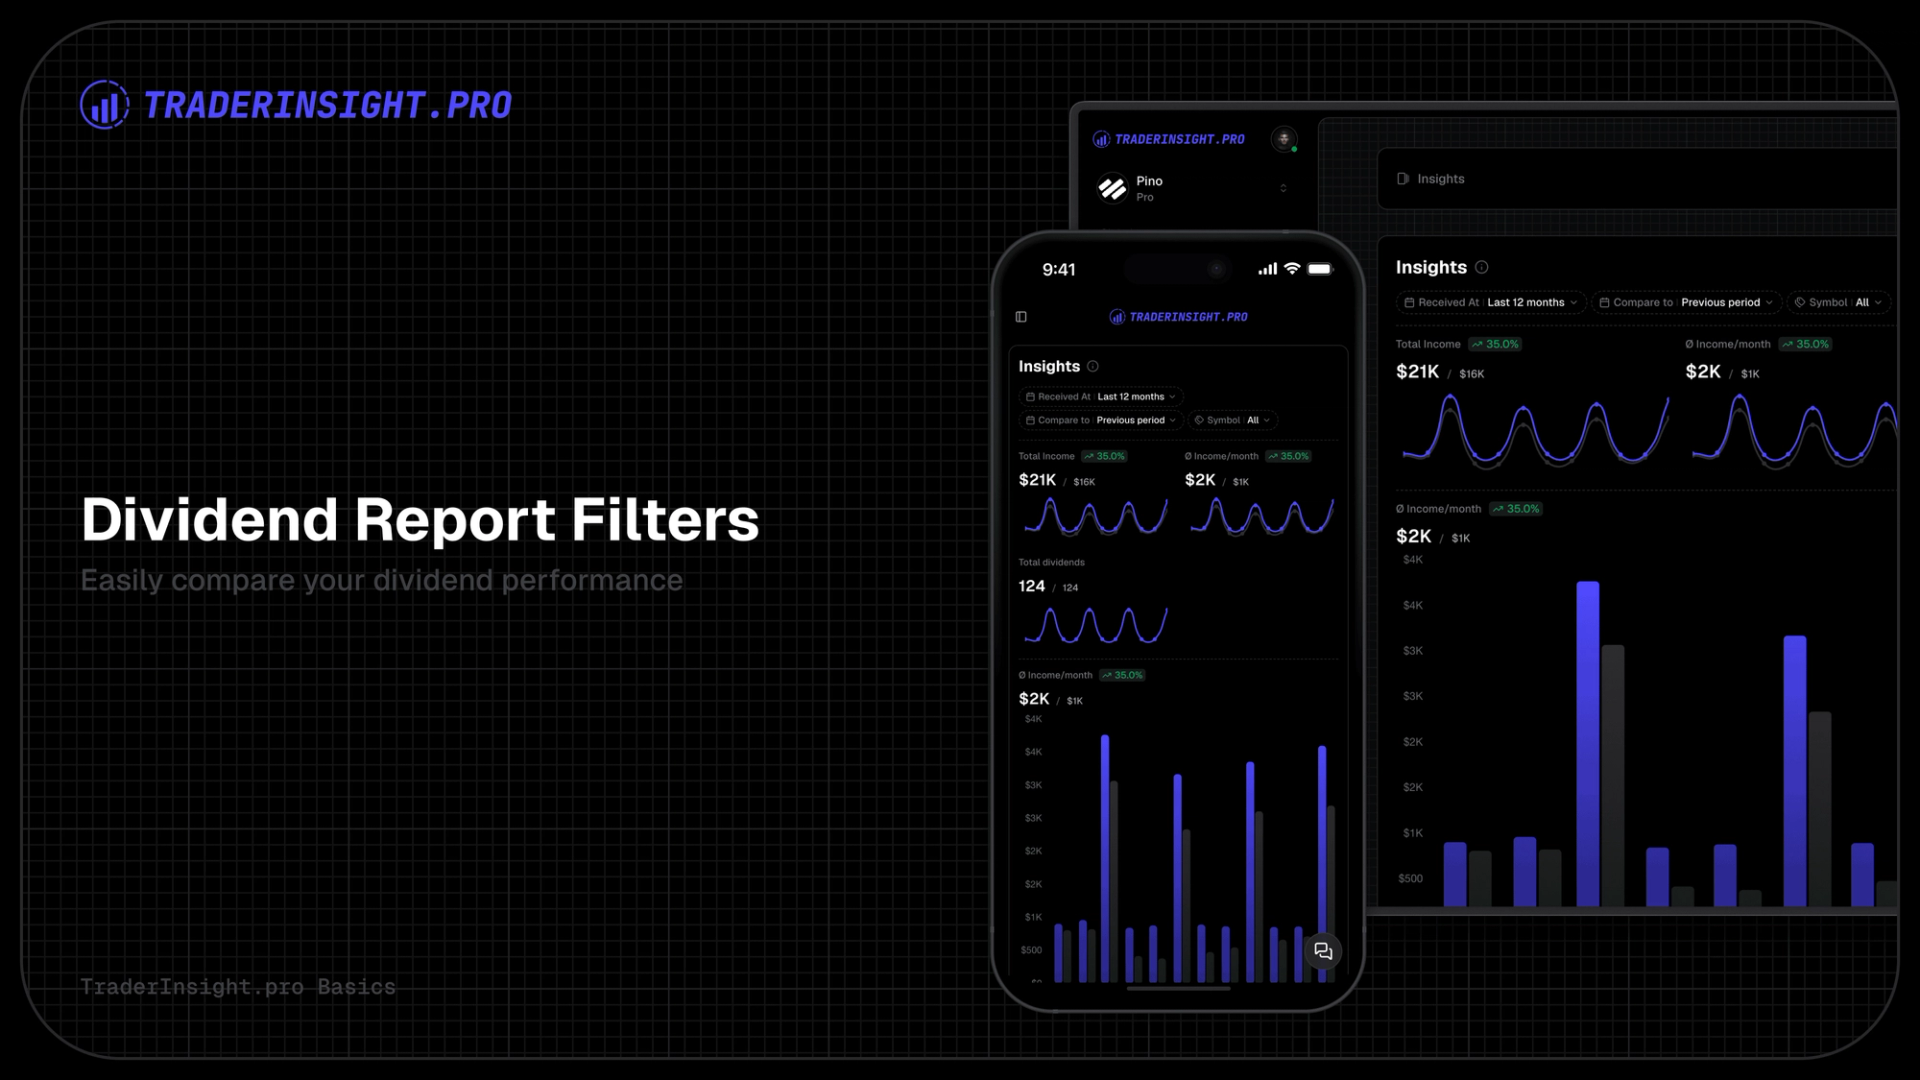
The dividend report in TraderInsight.pro now supports comparison date filtering, letting you measure income growth across any two periods instantly. Whether you track stocks, options, crypto, or any other income-generating asset, your dividend data is now significantly more actionable.
How does comparison filtering work in the dividend report?
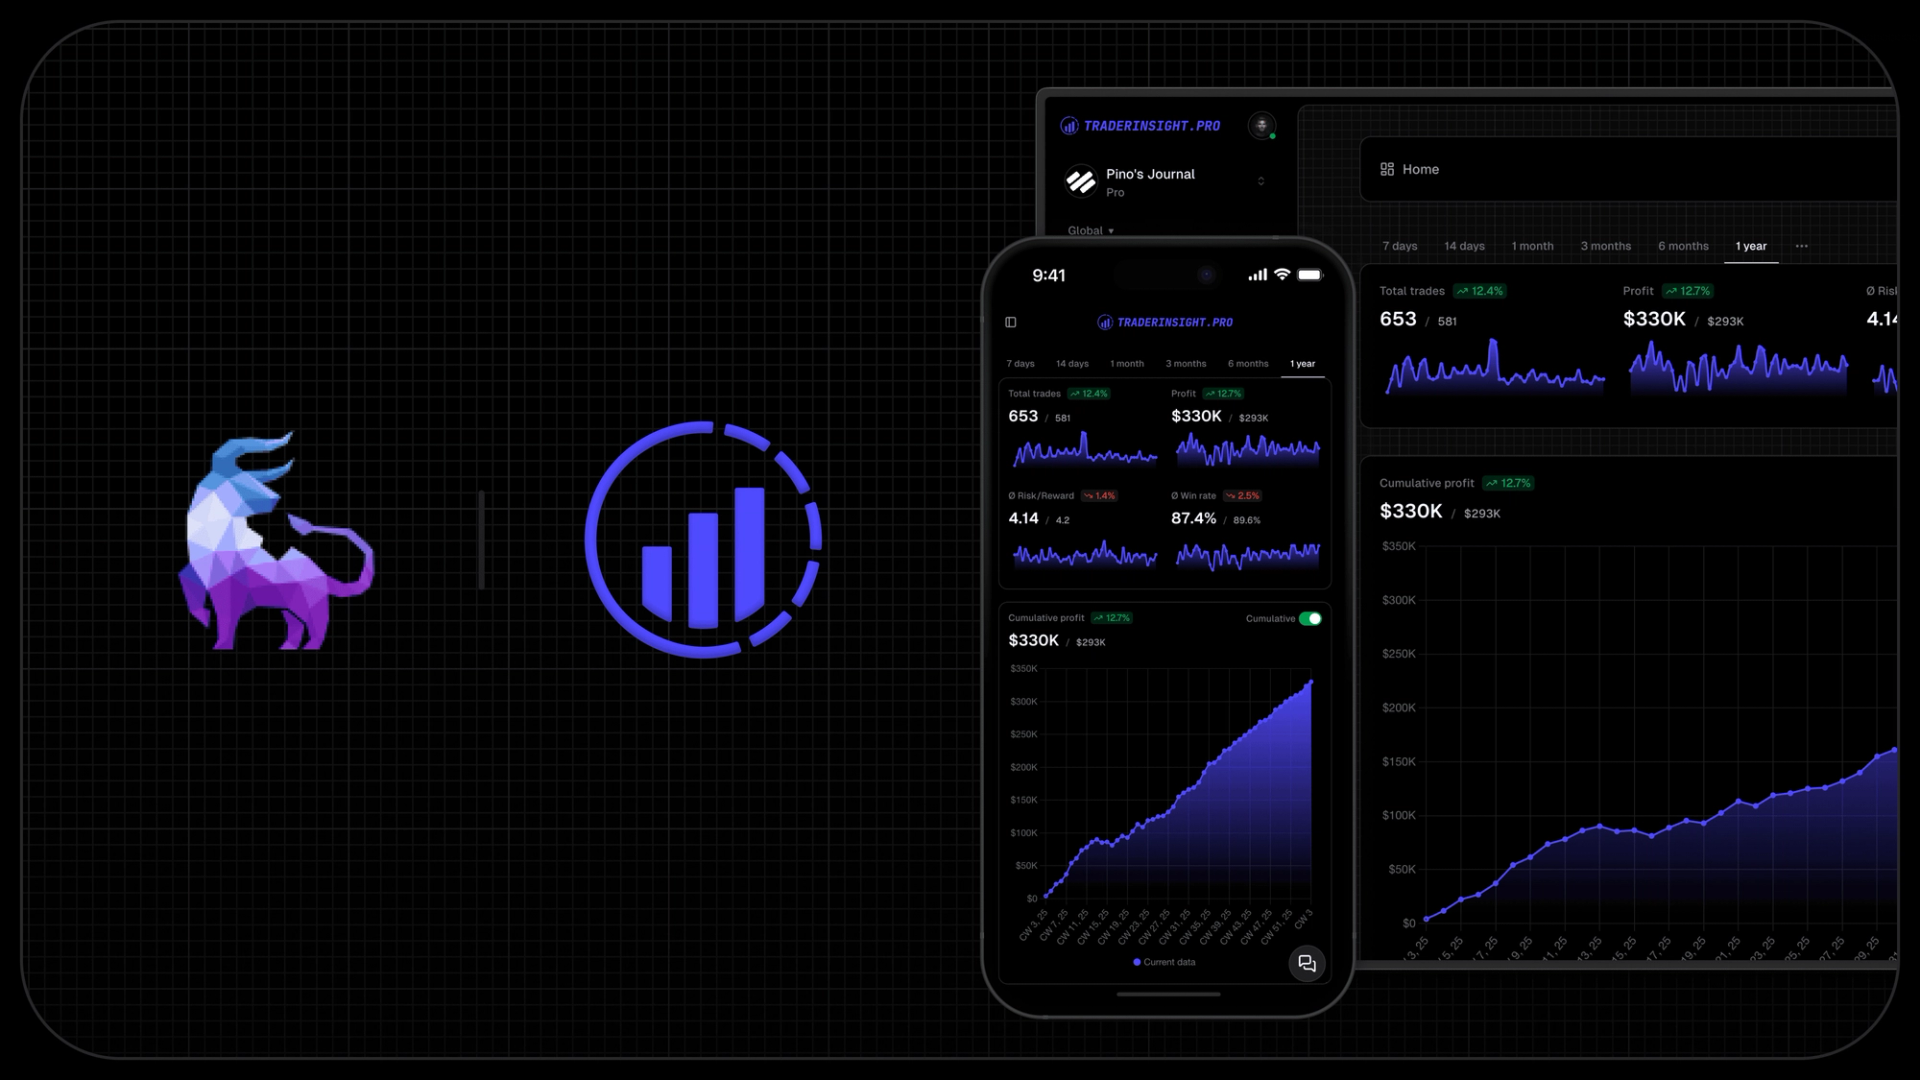
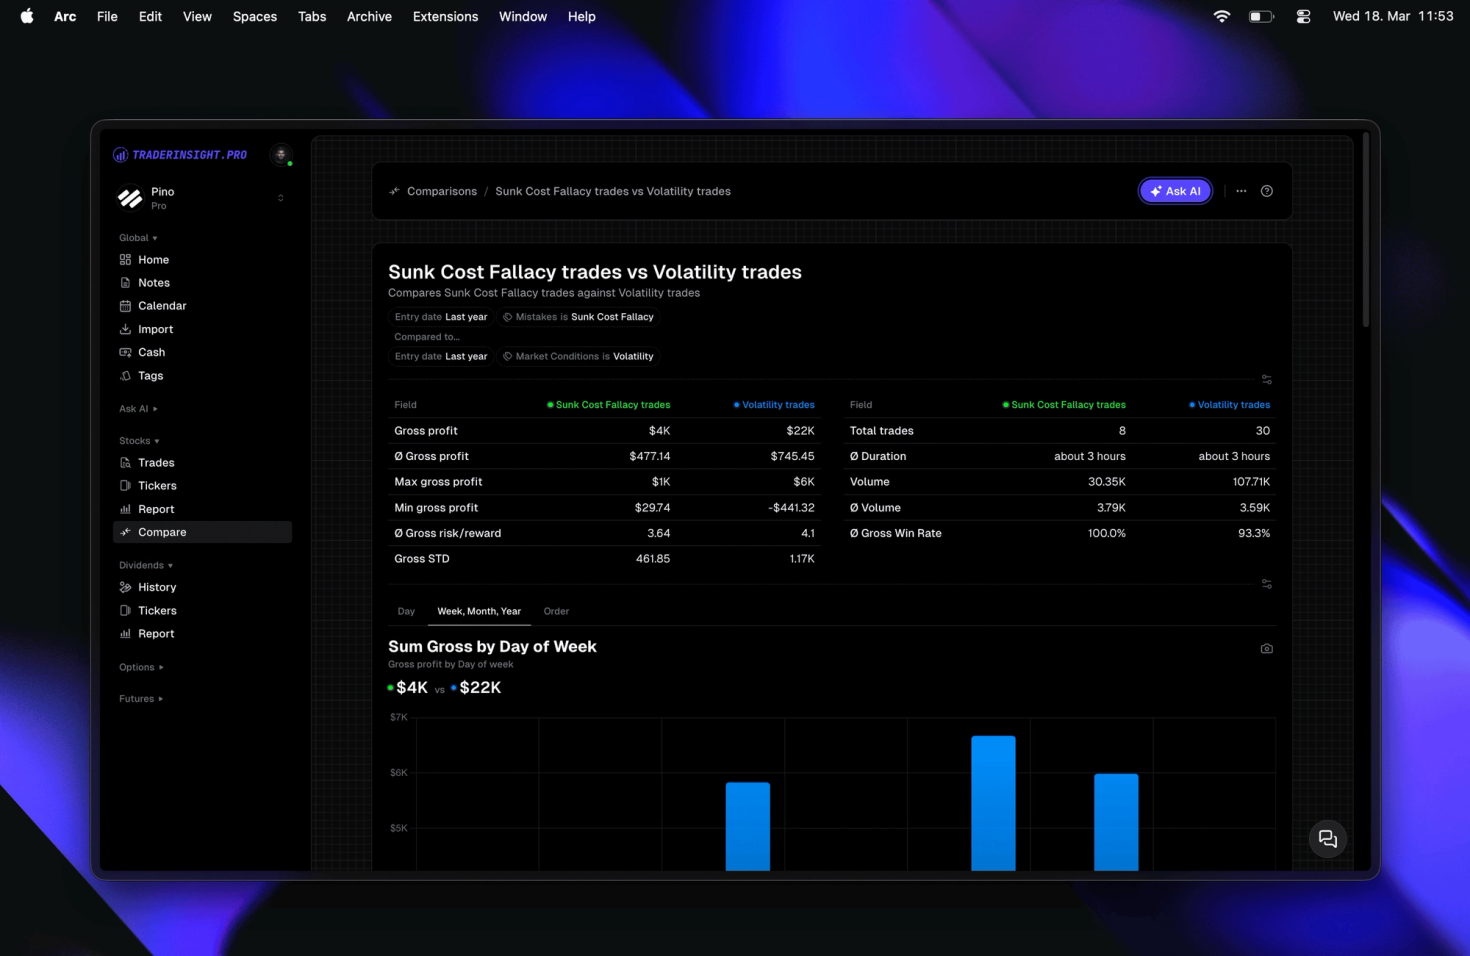
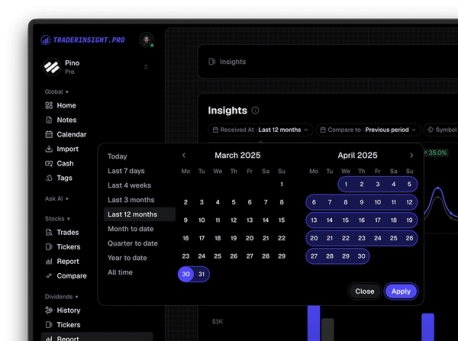
Select any two date ranges in the dividend report and your KPI cards and charts update immediately to show both periods side by side. The delta between them is surfaced directly in the report - no manual calculation, no exporting to a spreadsheet.
Common use cases:
- Month-over-month income tracking to confirm your portfolio is compounding
- Quarter-over-quarter comparisons ahead of tax reporting
- Year-over-year views to measure the long-term effect of reinvestment
What new filter options are available in the dividend report?
The dividend report now supports expanded filtering by ticker, account, date range, and more. This brings it in line with the filtering depth already available across performance reports and trading calendar views.
Filters across dividends, cash transactions, and notes now share a common foundation, so behavior is consistent regardless of which report surface you're working in. If you've learned how filters behave in one area of the journal, they work the same way everywhere else.
How to use the AI to analyze your dividend income
With comparison data now structured in the report, you can also ask your AI analysis direct questions about dividend trends. Questions like "which tickers paid the most dividends last quarter compared to the quarter before?" or "how has my total dividend income changed year over year?" are answered instantly against your actual journal data.
This is part of a broader effort to make every dimension of your journal - trades, dividends, cash, notes, and more - queryable through plain language, not just navigable through filters.
Frequently asked questions
What is the best trading journal for tracking dividend income?
TraderInsight.pro is purpose-built for traders and investors who need to track dividends alongside trades across stocks, options, futures, forex, crypto, and more. The dividend report supports comparison filters, AI-powered analysis, and custom performance reports - all in one journal.
Can I compare dividend income across two time periods?
Yes. The dividend report now includes a comparison date filter. Select any two periods and your KPIs and charts update immediately to show income side by side with the delta surfaced inline.
Does TraderInsight.pro support dividend tracking for long-term investors?
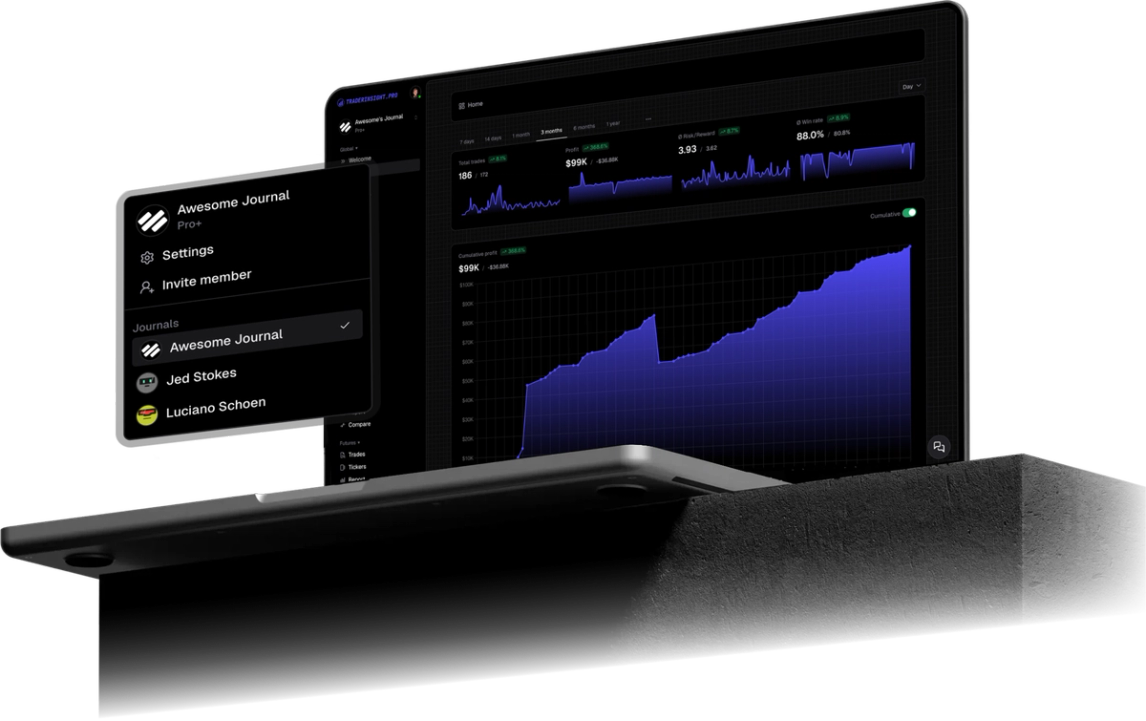
Yes. Investors tracking income-generating positions can import dividends, cash transactions, corporate events, and more. The journal is cross-platform across web, mobile, and tablet with full feature parity - so your data is available anywhere.
How do I ask the AI about my dividend income?
Open AI analysis and ask in plain English - "show me my dividend income by ticker this year" or "how does my Q1 dividend income compare to Q2?" The AI queries your actual journal data and responds instantly with charts, tables, or summaries depending on what you ask.
Start your trading journal and put your dividend data to work.