Table of Contents
Every filter you save automatically becomes a full Performance Report. One click to save - and you get a dedicated, customizable dashboard with charts, KPIs, and stats built exactly around what you filtered.
Time-Based Comparisons
The biggest edge comes from relative date ranges. Set “this month vs last month”, “this week vs last week”, “this year vs last year”, or “this quarter vs last quarter” in the filter. Save it - and the report instantly generates a side-by-side time comparison. You see clear evolution: win rate improving (or slipping), profit factor shifting, drawdowns changing - all laid out so trends pop immediately.
This is the feature most traders miss until they try it: proof of real progress (or hidden regression) over time, without manual setup.
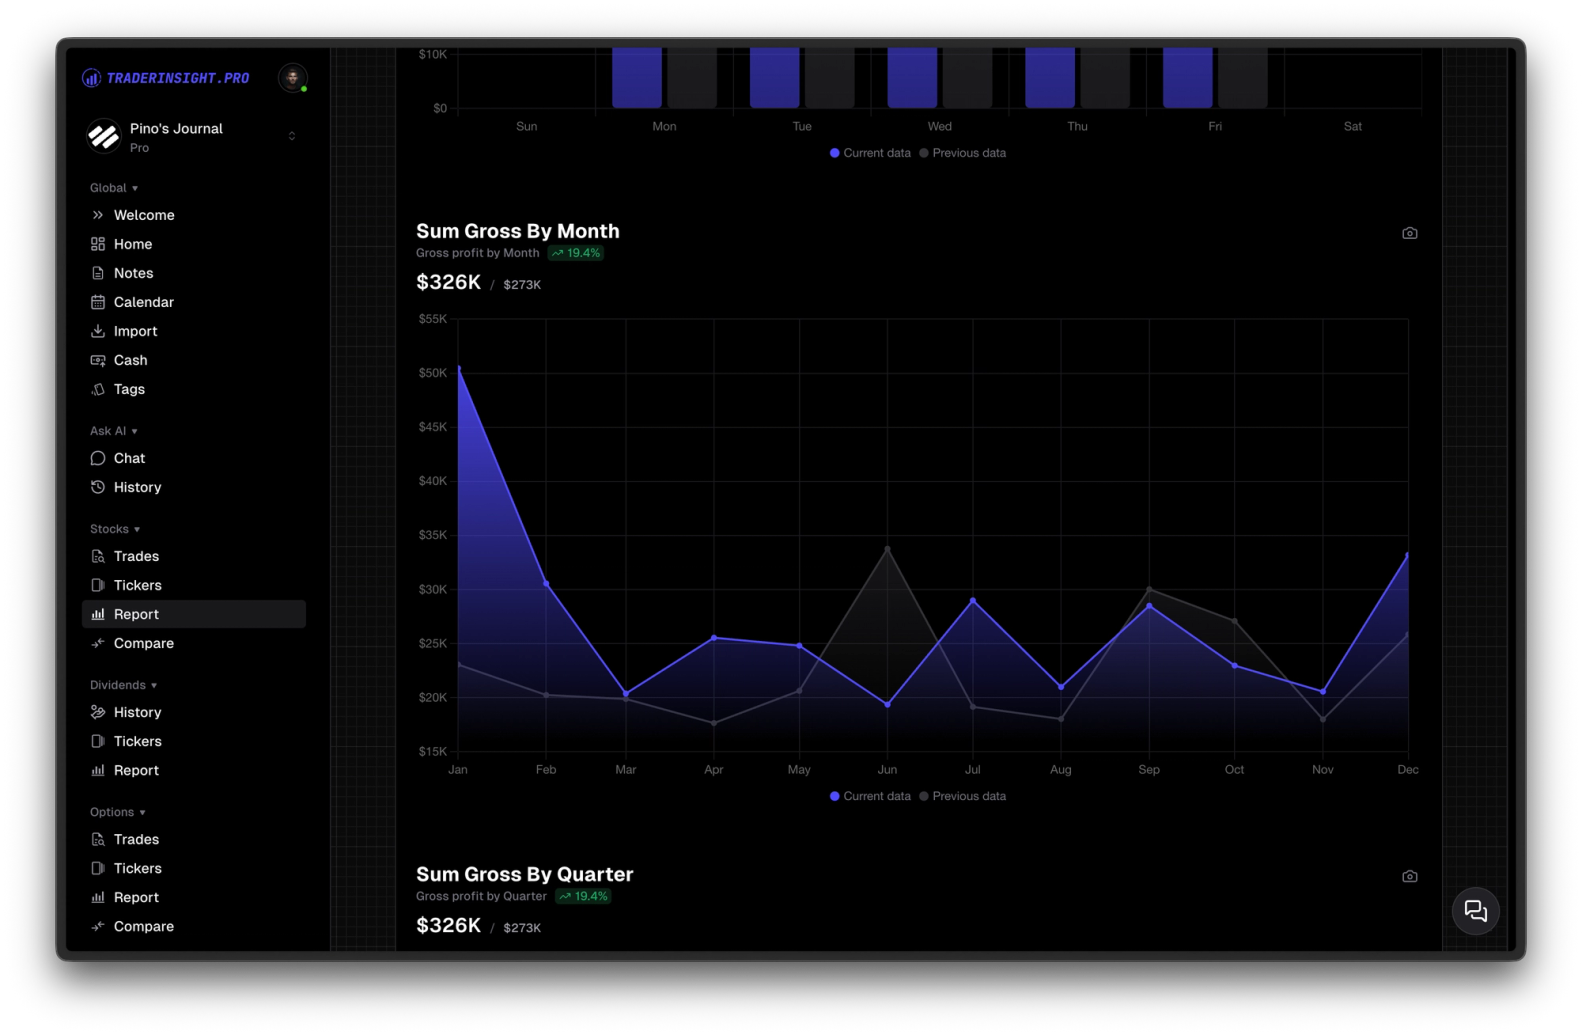
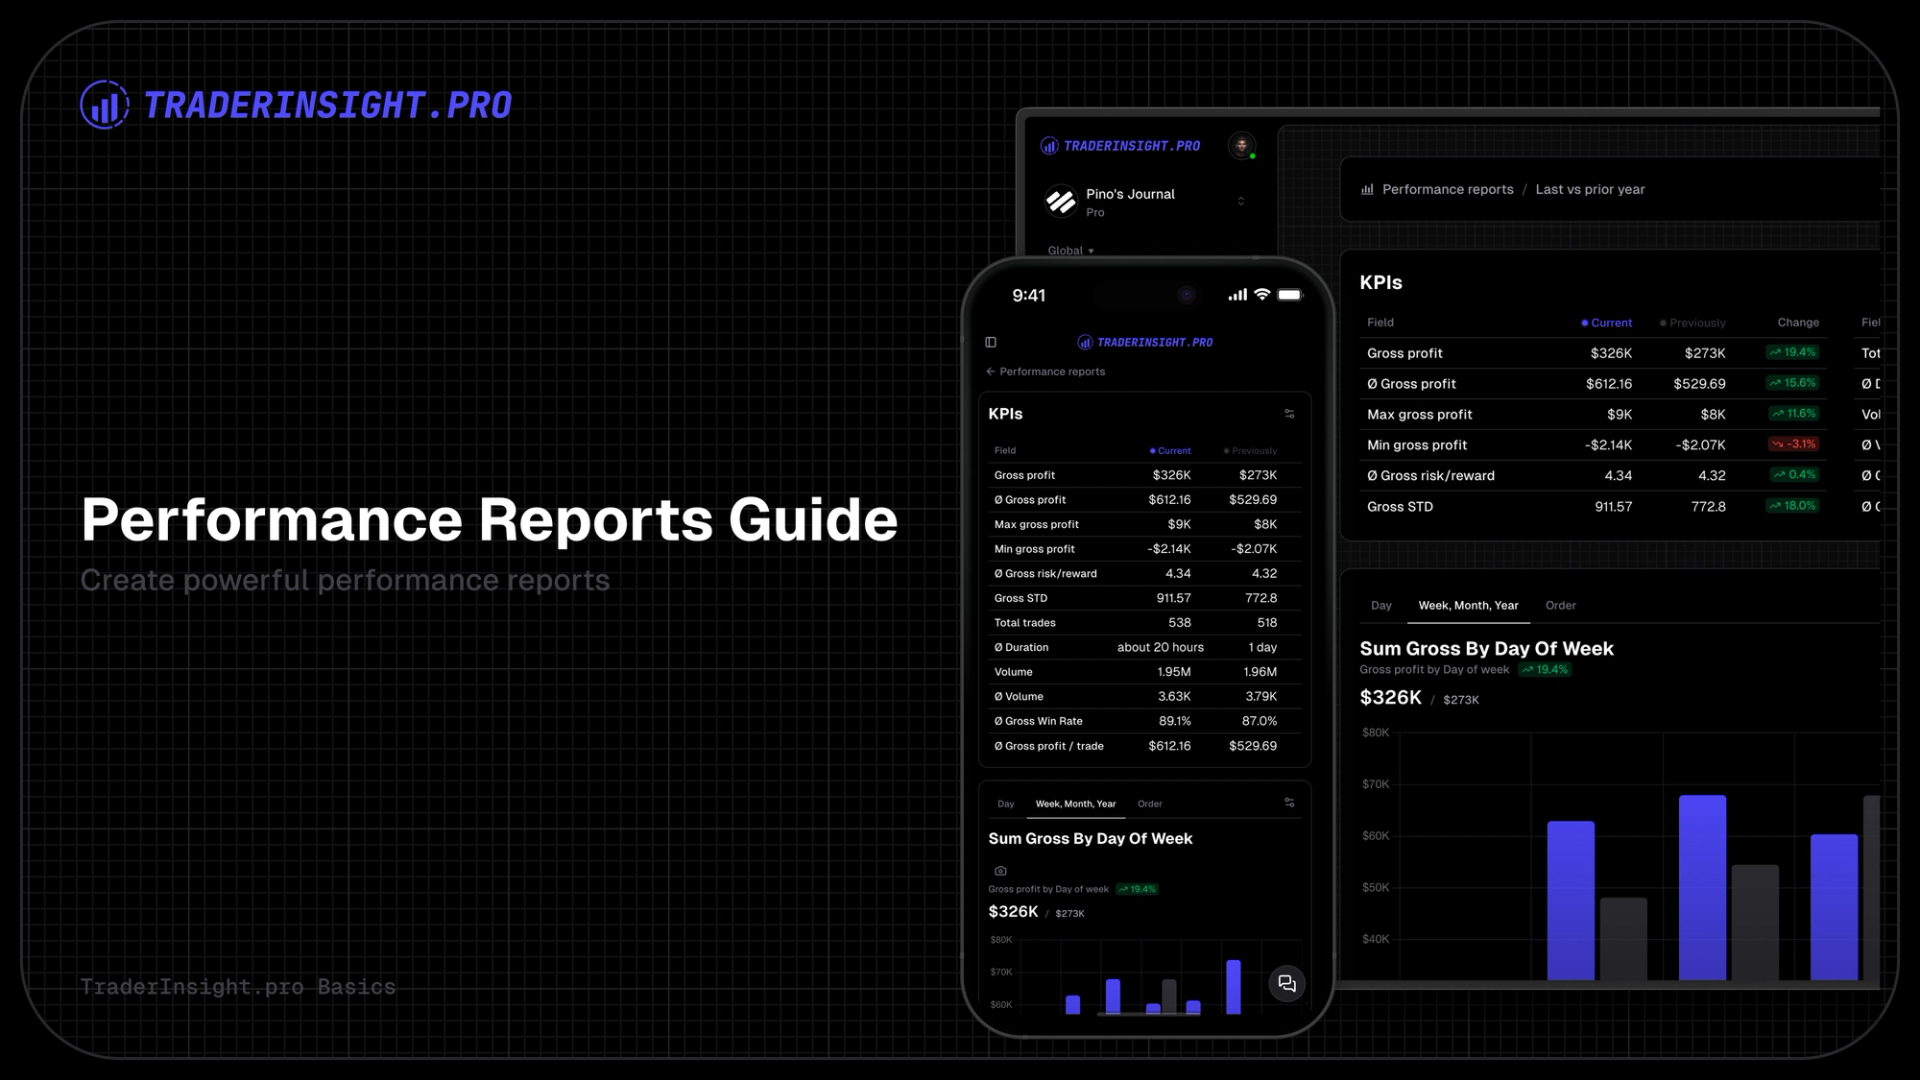
Performance Report Structure
- Stats overview at the top: win rate, profit factor, average risk/reward, total P/L, max drawdown, trade count, average duration, and more
- Full customization: toggle KPIs on/off, rearrange them to your liking
- Multiple tabs with charts: visual breakdowns that make patterns easy to spot
- Charts fully editable: switch types (
bar,line,area,pie,polar, etc.), adjust axes, add/remove tabs
Everything stays tied to your saved filter - always focused and automatically updated as new trades come in.
Practical Examples from real Traders
- Last 30 days vs prior 30 days → “Am I improving after tweaking my rules?”
- This year vs last year → “Is my edge holding up in different markets?”
- This month vs last month → “Did the new setup lift my average R?”
- This week vs last week → “How did I handle volatility spikes?”
Each date-comparison filter becomes a permanent, live report you can revisit anytime.
How to create a Report
- Go to any asset section (Stocks, Options, Futures)
- Open the filter menu
- Build your filter - optionally add a relative date comparison (e.g. this month vs last month)
- Save it
The Performance Report appears instantly in the Reports section - ready to view and customize.
Customize Once, Use Forever
In edit mode you can toggle/hide/rearrange KPIs, change chart types and axes, add or remove tabs. Save your changes - the report is now exactly how you want it, forever.
Head to your account, create a filter with a simple date comparison, save it - and watch your first time-based Performance Report appear. The first month-over-month insight usually feels like a wake-up call.
Start measuring real improvement today.