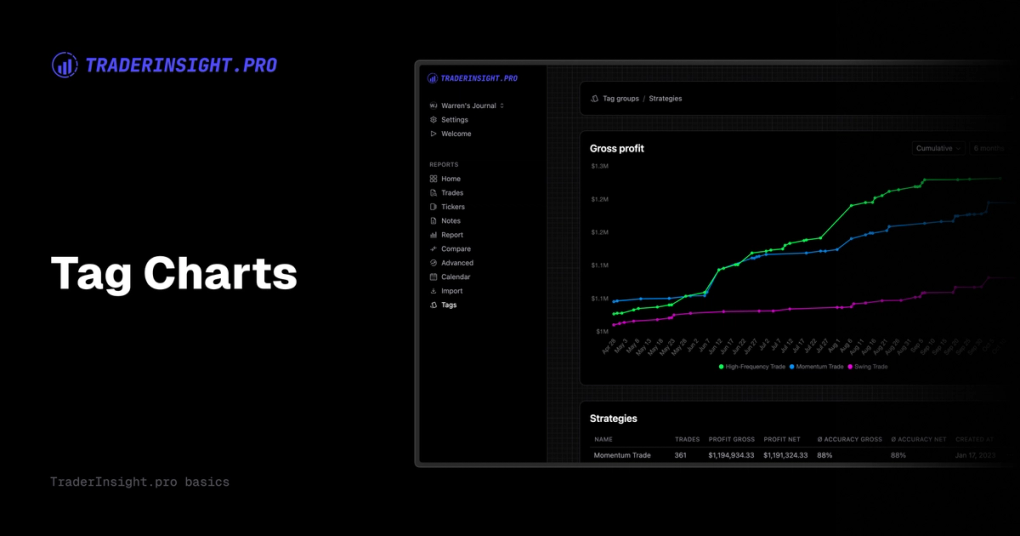
We're excited to introduce a new feature in our tag group reports: an intuitive main chart that gives you a clear view of your performance. Now, you can easily track trends across trading strategies, common mistakes, or any tag group, helping you uncover insights, monitor progress, and refine your trading approach.
What’s New?
When you open a tag group, you’ll now see a detailed chart in the hero section. This chart is designed to help you quickly grasp the profitability of each tag, such as a specific strategy or mistake, over a customizable time frame. No more digging through data to understand which strategies are performing well or where your weaknesses lie!
Flexible Time Frames
The chart allows you to set a time range that suits your analysis. You can choose from several preset time frames:
- 7 days
- 14 days
- 1 month
- 3 months
- 6 months
- 1 year
This flexibility ensures that you can zoom in on short-term trends or take a broader look at your trading over the longer term.
Two Powerful Data Views
To cater to different analytical needs, the chart offers two types of data visualizations:
- Daily Profit: View the total profit associated with each tag for each day within your selected time period. This is perfect for spotting patterns and fluctuations, helping you understand how specific strategies or mistakes affect your day-to-day trading.
- Cumulative Profit: Track the cumulative profit over the selected time period. This gives you a clearer picture of overall growth and helps you identify consistent winners or persistent challenges.
Why It Matters
This new chart isn’t just about aesthetics; it’s a tool designed to provide deeper insights into your trading patterns. By visualizing your data, you can quickly identify which strategies consistently bring in profits and which might need a second look. It’s all about making your trading journal more intuitive, informative, and ultimately, more useful.
We can’t wait for you to explore this new feature! Dive into your tag groups, play around with the time frames, and switch between daily and cumulative views to uncover insights that could improve your trading performance. Let us know what you think, and happy journaling!


